UNITED STATES
SECURITIES AND EXCHANGE COMMISSION
Washington, D.C. 20549
FORM 10-K
|
| |
x | Annual Report pursuant to Section 13 or 15(d) of the Securities Exchange Act of 1934 |
For the fiscal year ended March 31, 2013
or |
| |
¨ | Transition Report pursuant to Section 13 or 15(d) of the Securities Exchange Act of 1934 |
For the transition period from to .
Commission file number: 0-27266
WESTELL TECHNOLOGIES, INC.
(Exact name of registrant as specified in its charter)
|
| | |
Delaware | | 36-3154957 |
(State or other jurisdiction of incorporation or organization) | | (I.R.S. Employer Identification No.) |
750 North Commons Drive, Aurora, Illinois 60504
(Address of principal executive offices) (Zip Code)
Registrant’s telephone number, including area code: (630) 898-2500
|
| | |
Securities registered pursuant to Section 12(b) of the Act: | | Name of each exchange on which registered: |
Class A Common Stock, $.01 par value | | NASDAQ Global Select Market |
Securities registered pursuant to Section 12(g) of the Act: None
Indicate by check mark if the registrant is a well-known seasoned issuer, as defined in Rule 405 of the Act. Yes ¨ No x
Indicate by check mark if the registrant is not required to file reports pursuant to Section 13 of Section 15(d) of the Act. Yes ¨ No x
Indicate by check mark whether the registrant (1) has filed all reports required to be filed by Section 13 or 15(d) of the Securities Exchange Act of 1934 during the preceding 12 months (or for such shorter period that the registrant was required to file such reports), and (2) has been subject to such filing requirements for the past 90 days. Yes x No ¨
Indicate by check mark whether the registrant has submitted electronically and posted on its corporate Web site, if any, every Interactive Data File required to be submitted and posted pursuant to Rule 405 of Regulation S-T (§ 229.405 of this chapter) during the preceding 12 months (or for such shorter period that the registrant was required to submit and post such files). Yes x No ¨
Indicate by check mark if disclosure of delinquent filers pursuant to Item 405 of Regulation S-K (§229.405 of this chapter) is not contained herein, and will not be contained, to the best of registrant’s knowledge, in definitive proxy or information statements incorporated by reference in Part III of this Form 10-K or any amendment to this Form 10-K. ¨
Indicate by check mark whether the registrant is a large accelerated filer, an accelerated filer, a non-accelerated filer, or a smaller reporting company. See the definitions of “large accelerated filer,” “accelerated filer” and “smaller reporting company” in Rule 12b-2 of the Exchange Act. (Check One): |
| | | |
Large Accelerated Filer | ¨ | Accelerated Filer | x |
| | | |
Non-Accelerated Filer | ¨ (Do not check if a smaller reporting company), | Smaller Reporting Company | ¨ |
Indicate by check mark whether the registrant is a shell company (as defined in Rule 12b-2 of the Exchange Act). Yes ¨ No x
The estimated aggregate market value of voting and non-voting Class A Common Stock held by non-affiliates (within the meaning of the term under the applicable regulations of the Securities and Exchange Commission) as of September 30, 2012 (based upon an estimate that 62% of the shares are so owned by non-affiliates and upon the average of the high and low prices for the Class A Common Stock on the NASDAQ Global Select Market on that date) was approximately $82 million. Determination of stock ownership by non-affiliates was made solely for the purpose of responding to this requirement and registrant is not bound by this determination for any other purpose.
As of May 14, 2013, 45,073,067 shares of the registrant’s Class A Common Stock were outstanding and 13,937,151 shares of registrant’s Class B Common Stock (which automatically converts on a one-for-one basis into shares of Class A Common Stock upon a transfer of such stock except transfers to certain permitted transferees) were outstanding.
DOCUMENTS INCORPORATED BY REFERENCE
Portions of the registrant’s definitive proxy statement for the 2013 Annual Stockholders’ Meeting are incorporated by reference into Part III hereof.
WESTELL TECHNOLOGIES, INC.
2013 ANNUAL REPORT ON FORM 10-K CONTENTS
|
| | |
| | Page |
Item | | |
1. | | |
1A. | | |
1B. | | |
2. | | |
3. | | |
4. | | |
| | |
| | |
5. | | |
6. | | |
7. | | |
7A. | | |
8. | | |
9. | | |
9A. | | |
9B. | | |
| | |
| | |
10. | | |
11. | | |
12. | | |
13. | | |
14. | | |
| | |
| | |
15. | | |
| | |
CAUTIONARY STATEMENT REGARDING FORWARD-LOOKING INFORMATION
Certain statements contained herein that are not historical facts or that contain the words “believe,” “expect,” “intend,” “anticipate,” “estimate,” “may,” “will,” “plan,” “should,” or derivatives thereof and other words of similar meaning are forward-looking statements that involve risks and uncertainties. Actual results may differ materially from those expressed in or implied by such forward-looking statements. Factors that could cause actual results to differ materially include, but are not limited to, product demand and market acceptance risks, need for financing and capital, economic weakness in the United States (“U.S.”) economy and telecommunications market, the effect of international economic conditions and trade, legal, social and economic risks (such as import, licensing and trade restrictions), the impact of competitive products or technologies, competitive pricing pressures, customer product selection decisions, product cost increases, component supply shortages, new product development, excess and obsolete inventory, commercialization and technological delays or difficulties (including delays or difficulties in developing, producing, testing and selling new products and technologies), the ability to successfully consolidate and rationalize operations, the ability to successfully identify, acquire and integrate acquisitions, effects of the Company’s accounting policies, retention of key personnel and other risks more fully described in this Form 10-K for the fiscal year ended March 31, 2013, under Item 1A—Risk Factors. The Company undertakes no obligation to publicly update these forward-looking statements to reflect current events or circumstances after the date hereof or to reflect the occurrence of unanticipated events or otherwise.
Trademarks
The following terms used in this filing are our trademarks: AIDIRECTOR®, AIREMOTE®, AISWITCH®, APPLIED INNOVATION®, WESTELL BOXER®, CellPak®, D-SERV®, eSmartAccess™, Homecloud™, Kentrox®, Optima™, OS Plant Systems®, WESTELL SHADE®, WESTELL TECHNOLOGIES™, VirtualEdge and Design® and Westell®. All other trademarks appearing in this filing are the property of their holders.
PART I
Westell Technologies, Inc., (the “Company”) was incorporated in Delaware in 1980 and is headquartered at 750 North Commons Drive, Aurora, Illinois 60504. In fiscal year 2013, the Company was comprised of two operating segments, Westell and Customer Networking Solutions (“CNS”). Segment financial information for fiscal years 2013, 2012 and 2011 is set forth in the footnotes to the March 31, 2013 consolidated financial statements.
Acquisition of Kentrox
On April 1, 2013, the Company's wholly-owned subsidiary, Westell, Inc. acquired 100% of the Kentrox, Inc. ("Kentrox") stock for $30.0 million cash, subject to an adjustment for working capital and escrow provisions. Kentrox is a worldwide leader in intelligent site management solutions, providing comprehensive monitoring, management and control of any site. The machine-to-machine communications Kentrox provides enable service providers, tower operators, and other network operators to reduce operating costs while improving network performance. Kentrox provides solutions to customers in North and South America, Australia, Africa, and Europe. The assets and liabilities acquired and the results of operations relating to Kentrox will be included in the Company's Consolidated Financial Statements from the date of acquisition.
Acquisition of ANTONE Wireless
On May 15, 2012, Westell, Inc. acquired certain assets and liabilities of ANTONE Wireless Corporation, including rights to ANTONE products, for $2.5 million cash, subject to an adjustment for working capital, plus contingent cash consideration of up to $3.5 million. The contingent consideration is based upon profitability of the acquired products for post-closing periods through June 30, 2016. The acquisition included inventories, property and equipment, contract rights, intangible assets, and certain specified operating liabilities that existed at the closing date. The Company also hired most of ANTONE’s employees. ANTONE products include a line of high-performance Tower-Mounted Amplifiers, Multi-Carrier Power Amplifier Boosters, and cell-site antenna-sharing products.
Sale of ConferencePlus
On December 31, 2011, the Company sold Conference Plus, Inc. (“ConferencePlus”), its conferencing segment, to Arkadin S.A.S. and Arkadin Inc. ConferencePlus results have been classified as discontinued operations on the Consolidated Statements of Operations for all periods presented.
Westell Segment
In the Westell segment, the Company designs, distributes, markets and services a broad range of carrier-class products. The Company’s Westell product family consists of indoor and outdoor cabinets, enclosures and mountings; power distribution products; network interface devices (“NIDs”) for TDM/SONET networks and service demarcation; span powering equipment; remote site monitoring devices; copper/fiber connectivity panels; managed Ethernet switches for utility and industrial networks; Ethernet extension devices for providing native Ethernet service handoff in carrier applications; wireless signal conditioning and monitoring products for cellular networks; tower-mounted amplifiers; cell site antenna-sharing products for cell site optimization; and custom systems integration (“CSI”) services. Legacy products are sold primarily into wireline markets, but the Company also is actively moving to develop revenues from wireless telecommunications products and from industrial and utility companies. In the quarter ended September 30, 2012, the Company completed the relocation of the majority of the power distribution and remote site monitoring products which were manufactured at the Company’s Noran Tel subsidiary located in Regina, Saskatchewan, Canada, to its location in Aurora, Illinois. The remaining operations in Canada are focused on power distribution product development and on sales of Westell products in Canada.
The following table sets forth a list of the Company's principal Westell segment products and their applications:
Westell Segment Products Table
|
| | |
Product Description | | Applications |
Cell Site Optimization: Consists of Tower Mounted Amplifiers, small outdoor-hardened amplifiers mounted next to the antennas on cell towers; and associated ancillary products for powering amplifiers and sharing antenna feeds. | | Used by wireless service providers at cell sites to improve the receive and transmit signal strengths and cell site performance, thereby improving coverage area, data throughput and the overall experience of wireless users, and reducing dropped call rates, dropped packets, and dead zones. |
| |
DAS Interface Panels: Interconnects a wireless Base Transceiver System (BTS) to a Distributed Antenna System (DAS) by providing field-adjustable attenuation and monitoring of the Radio Frequency (RF) levels. | | Used by wireless service providers and neutral-party DAS hosts to fine tune the RF signal levels for maximum performance of a given DAS installation and configuration. Works in both indoor and outdoor DAS locations. |
| |
Ethernet Solutions: Consists of eSmartES Managed Ethernet Switches, industrial-hardened, multiport, remotely-managed Ethernet switches with a variety of port count and connectivity options (both fiber and copper), including models with advanced powering and site telemetry features; and eSmartJack Ethernet NIDs, hardened, remotely-managed Ethernet Network Interface Devices (NIDs) to monitor the performance of Ethernet services and provide a point of demarcation between carrier and end user. | | Used by service providers, utilities and industrial users to create and interface to public or private Ethernet networks in both indoor and harsh outdoor environments. Also used by service providers to interface to Metro Ethernet networks for the backhaul of cellular traffic from cell sites, and the delivery of business-class Ethernet services to end users. Provides management features to show visibility into the performance of the network and the site environment. |
| |
SONET/TDM Solutions: Network Interface Units with Performance Monitoring features for DS3/T3 and DS1/T1 circuits; line repeaters for T1 circuits; and span powering equipment, to inject power onto DS1 spans for powering remote equipment. | | Facilitates the maintenance, monitoring, extension, and demarcation of DS3/T3 and DS1/T1 facilities. Can be deployed in central offices for a DS3 or DS1 hand-off to alternate carriers, in mid-span locations in the outside plant, and also in customer premises locations to provide a point of demarcation between the telecom service provider's equipment and the customer’s equipment. |
| |
Power Distribution: Fuse panels and breaker panels for installation in equipment racks to connect up to bulk power circuits and distribute power to other equipment via individual power feeds with fuses or breakers. | | Standard 19” or 23” rack mounting for service providers central offices, remote terminals and enclosures to provide secondary DC power distribution to operate equipment. Safely protects operating equipment in the event of fault current. |
| | |
Remote Site Monitoring: Rack-mounted devices with internal sensors and connections for external sensors to provide visibility into remote site environmental conditions such as temperature, battery voltage, and equipment status and alarms. Status information and alarms are communicated back to a centralized management system typically located at a network operations center. | | Applications include service provider’s central offices, remote terminals, and enclosures to provide environmental information such as temperature, air flow, humidity and smoke, battery condition, and equipment operating status. |
(Continued from prior page)
Westell Segment Products Table
|
| | |
Product Description | | Applications |
Cabinets, Enclosures and Mountings: Includes outdoor cabinets in a variety of sizes and configurations for sheltering equipment and maintaining a proper operating temperature in harsh outdoor environments; enclosures for protecting equipment in both outdoor and indoor environments; and pre-wired mountings to accommodate plug-in cards from Westell and other manufacturers for a variety of telecom technologies, including Ethernet NIDs, T1 NIUs and HDSL remote terminal cards. | | Outdoor cabinets and enclosures are used by service providers, utilities and industrial users for locating sensitive equipment in exposed outdoor environments. Indoor enclosures house equipment and protect it from unauthorized access. Mountings are deployed by service providers to accommodate line cards which terminate their Ethernet, T1 and HDSL circuits as a point of demarcation at business enterprise customers and at cell sites for cellular backhaul applications. |
| |
Copper/Fiber Connectivity: A flexible portfolio of standard 19” or 23” relay rack mount panels and wall mount enclosures designed with a “mix and match” architecture for Ethernet, fiber or coax cable. These products facilitate easy and simple splicing of optical fiber cables, and/or termination of copper-based Ethernet, and coax handoffs. | | Provides a physical demarcation for Ethernet, DS1/T1, DS3/T3, optical fiber and coax based services at the customer premises. |
| |
Customized Systems Integration Services: A one-stop shop for complete turnkey solutions of customer-specified equipment installed in a Westell cabinet or enclosure. | | CSI service is ideal for customers benefiting from integrated solutions for backhaul, smart grid and other custom applications. CSI reduces time-to-market and the costs of technicians for field installations, and eliminates the need to design, assemble and test on the job site. |
CNS Segment
On April 15, 2011, the Company sold certain assets and transferred certain liabilities of the CNS segment to NETGEAR, Inc. The Company retained a major CNS customer relationship and contract. The Company completed the remaining contractually required product shipments under the retained contract in December 2011. During the first three quarters of fiscal year 2013, the Company continued to provide warranty services under its contractual obligations and to sell ancillary products and software on a project basis to the retained customer.
The Company also retained within its CNS division the Homecloud product. The Homecloud product provides a suite of services into the home for a variety of applications. These applications include: automated backup; file archival and versioning; file sharing and syncing between personal computers and mobile devices; media streaming; network attached file storage; automated syncing of information to public cloud services; and remote access to information. The Company is actively marketing the Homecloud technology for sale and expects limited CNS expense in fiscal year 2014.
Kentrox Summary
Effective as of April 1, 2013 with the acquisition of Kentrox, the Company designs, distributes, markets and services intelligent site management solutions, which provide comprehensive monitoring, management and control of a broad range of devices. The machine-to-machine (M2M) communications Kentrox provides enable service providers, tower operators, and other network operators to reduce operating costs while improving network performance. The Company provides a suite of Remote monitoring and control devices, which when combined with its Optima management system provide a comprehensive, bi-directional solution. The Kentrox solution addresses customer needs such as power management (generator management, battery, fuel, and rectifier monitoring, tenant power metering, etc.), environmental management (HVAC monitoring, energy monitoring and control, aircraft warning light management, and environmental monitoring), security management (access management, asset tampering, and surveillance), and communications management (microwave and distributed antenna systems management). Customers include major wireless and fixed-line telecommunications carriers, tower providers, cable and broadband network providers, utility companies, and enterprises. Kentrox provides solutions to customers in North and South America, Australia, Africa, and Europe.
Kentrox Products and Services Descriptions
Remote Products: Includes monitoring and control devices that provide IP management to remote sites and equipment. The Remote suite of products connects to each element via a wide variety of interface options. Remote performs protocol mediation and interface conversion, collects alarms and monitoring data, and supports bi-directional management control with the Optima management system via Ethernet, T1/E1, or wireless communication options.
Optima Management System: Provides network operators a complete, 360 degree view and control of network infrastructure sites. The management portal provides preventative maintenance tools to help identify issues before they occur. It also provides performance reporting to enable operators to view trending and availability of their networks. Key features include: ability to remotely collect, monitor, trend and report on-site performance; real time dashboard and map views of network and physical elements; remote access from anywhere for remote configuration, backup, and restore or to check the health of the network; and element management for status updates of network elements.
Support and Services: Includes a range of support, maintenance, deployment and training services tailored to meet specific customer needs. The Company's deployment services help implement Kentrox solutions into a network, including site surveys, installation, provisioning, and project management. The Company's training services provide technical training on its Remote products and Optima Management System. The Company's support and maintenance options provide a range of post-deployment support from access to software updates, to next-day on-site technical support.
Research and Development Capabilities and Engineering Base
The Company believes that its future success depends, in part, on its ability to maintain the technological capabilities of its products through enhancements of its existing offerings and to develop new products that meet customer needs. Thus, the Company expects to continue to devote substantial resources to product development.
In fiscal years 2013, 2012 and 2011, the Westell segment incurred approximately $5.7 million, $5.1 million, and $3.8 million and the CNS segment incurred approximately $1.6 million, $2.6 million, and $7.9 million, respectively, of expense for research and development (“R&D”) activities.
The Company's R&D personnel are organized into product development teams. Each product development team is generally responsible for sustaining technical support of existing products, conceiving new products in cooperation with other groups within the Company and adapting standard products or technologies to meet new customer needs. Additionally, in an effort to remain a highly valued, superior quality, long-term supplier, each product development team is charged with reducing product costs for each succeeding generation of products without compromising functionality or serviceability. The product development teams leverage the Company’s relationships with its manufacturing partners and suppliers to achieve these cost reduction objectives.
The Company believes that the key to its R&D strategy is choosing an initial architecture for each product that balances innovation and time-to-market factors while enabling engineering innovations to result in future performance enhancements and cost reductions. The Company’s strategy is further enhanced by ensuring products are designed in conjunction with input from customers, procurement, and outsource manufacturing partners. The Company believes it has a quality record that is grounded in a solid interface and transference of knowledge among design and manufacturing teams.
The Company’s quality systems, including product development processes, are registered to ISO9001:2008 International Quality System Standard and TL9000, which is the Telecommunication Industry's sector-specific version of the ISO9001:2008. The Company believes product quality and reliability are critical and distinguishing factors in a customer’s selection process.
The Company expenses software development costs until its products reach technological feasibility, as defined by software accounting rules.
Pursuant to the Company’s strategic plans and in response to customer and market demands, the Company continues to develop additional models, variants and extensions of the products listed in the above Westell Segment Products Table.
The Company’s products are subject to industry-wide standardization organizations which include Telcordia, the Internet Engineering Task Force, the Metro Ethernet Forum, the American National Standards Institute (“ANSI”) in the U.S. and the International Telecommunications Union (“ITU”).
Customers
The Company's principal customers are providers of telecommunications services and infrastructure (“telecom providers”). These include major wireline and wireless service providers, internet service providers, multiple systems operators ("MSOs") and other telecommunications carriers. The Company historically has served customers predominantly in North America, however, with the recent Kentrox acquisition the Company expects to expand solutions to customers in South America, Australia, Africa, and Europe. The Company also sells products to other entities, including utility and industrial companies, systems integrators and distributors.
Marketing, Sales and Distribution
The Company sells its products through its domestic field sales organization and selected distributors and markets its products to service providers within the U.S. and Canada.
Major service providers require vendor product approval before use in their networks. Evaluation can take as little as a few months for products that vary slightly from existing products and often longer for products based on new technologies and/or new service offerings. Accordingly, the Company is continually submitting successive generations of its current products, as well as new products, to its customers for approval.
The Company provides customer support, technical consulting, research assistance and training to some of its customers with respect to the installation, operation and maintenance of its products.
The Company’s contracts with its major customers are primarily pricing and product specification agreements that detail the commercial terms and conditions for sales. These agreements are requirements-based and typically do not obligate the customer to a specific volume of purchases over time. The agreements may require the Company to accept returns of products within certain time limits, or indemnify such customers against certain liabilities arising out of the use of the Company's products. If these claims or returns are significant, there could be a material adverse effect on the Company's business and results of operations.
Most of the Company’s products carry a limited warranty ranging up to seven years for Westell segment products, which generally covers defects in materials or workmanship and failure to meet published specifications, but excludes damages caused by improper use. In the event there are material deficiencies or defects in the design or manufacture of the Company’s products, the affected products could be subject to recall.
Manufacturing and Procurement
The Company outsources the majority of its manufacturing to both domestic and offshore suppliers. Some Power, Cell Site Optimization, DAS, Ethernet, CSI and remote monitoring products are currently produced at the Company’s headquarters in Aurora, IL. Some Kentrox products are produced in Dublin, OH. Reliance on third-party domestic and offshore subcontractors involves risks. Standard commercial components available from multiple suppliers are procured by the suppliers. In some cases, there are also single-sourced components and technology needed to produce products. The Company has direct relationships and purchase contracts with suppliers for these items and may maintain inventory for these items at the subcontractors’ locations. Critical components, technology shortages or business interruption at our contract manufacturers could cause production delays that may result in expediting costs or lost business.
A substantial portion of the Company's shipments in any fiscal period can relate to orders received in that period. Further, a significant percentage of orders may require delivery within 48 hours. To meet this demand, the Company maintains inventory at its facilities and customers’ sites. Because of the rapid technological changes to our products, the Company faces a recurring risk that the inventory it holds may become obsolete.
Competition
The markets for the Company’s products are intensely competitive and the Company has no reason to believe that this competitive environment will ease in the future. The Company’s primary competitors vary by market. Some of the Company’s principal competitors in the Westell segment include ADTRAN, Inc., Charles Industries, Ciena, Emerson, Purcell, Ruggedcom, TE Connectivity and Telect. Some of the Company's principal competitors in the Kentrox segment include Inala, Quest Controls, Asentria, Invendis and DPS Telecom.
The Westell segment sells demarcation solutions including cabinets, enclosures, T1 network interface units and T1 network protection devices to the cellular backhaul market. The Company believes that as the market transitions from T1 to Ethernet, and as alternative solutions are deployed for cellular backhaul and enterprise connectivity, including Ethernet, fiber and microwave, the demand for the Company’s traditional Westell T1-type transmission products will decline. (Also, see Risk Factors in Item 1A of this report.)
Backlog
Product shipments are generally made pursuant to standard purchase orders, which are officially acknowledged according to standard terms and conditions. Seasonality may cause revenue to differ from quarter to quarter. The Westell segment sells equipment that is installed outdoors and the ordering of such equipment declines during and in advance of the colder months. Budget cycles for our customers may also contribute to revenue variability in those same periods. Purchase orders are generally received less than a month prior to shipment.
As of May 14, 2013, and May 14, 2012, the Westell segment had $2.0 million and $2.8 million of backlog, respectively. The recently acquired Kentrox segment had $10.8 million of backlog as of May 14, 2013.
International Revenue
Revenues from continuing operations from international customers represented approximately $2.4 million, $2.4 million and $2.5 million of the Company’s revenues in fiscal years 2013, 2012, and 2011, respectively, which represents approximately 6.0%, 3.4% and 1.7% of the Company's total revenues in such years.
Major Customers
The Company depends, and may continue to depend, on the telecom service providers and other independent local exchange carriers for the majority of its revenues. Sales to the Company’s largest customers, Verizon, Telamon, and Time Warner Cable accounted for 19.7%, 12.0%, and 10.1%, respectively, of the Company's total revenues in fiscal year 2013.
Proprietary Rights and Intellectual Property
The Company’s success and future revenue growth will depend, in part, on its ability to protect trade secrets, obtain or license patents and operate without infringing on the rights of others. The Company relies on a combination of technical leadership, copyrights, trademarks, trade secrets and other intellectual property, nondisclosure agreements and other protective measures to protect its proprietary know-how. The Company regards some of its technology as proprietary. The expiration of any of the patents held by the Company would not have a material impact on the Company. From time to time, the Company expects to seek additional patents related to its research and development activities.
Employees
As of May 1, 2013, the Company had 174 full-time employees. The following table reflects headcount by segment and functional area. No employees remain in the CNS segment.
|
| | | | | | | | | | | |
| Westell | | Kentrox | | Corporate | | Total |
Operations | 21 |
| | 22 |
| | — |
| | 43 |
|
Sales and marketing | 32 |
| | 16 |
| | — |
| | 48 |
|
Research and development | 34 |
| | 18 |
| | — |
| | 52 |
|
General and administrative | 1 |
| | 8 |
| | 22 |
| | 31 |
|
Total employees | 88 |
| | 64 |
| | 22 |
| | 174 |
|
Available Information
The SEC maintains an internet site, www.sec.gov, through which you may access the Company’s annual report on Form 10-K, quarterly reports on Form 10-Q, current reports on Form 8-K, proxy and other information statements, as well as amendments to these reports. In addition, the Company makes these reports available free of charge on the Company’s internet website, www.westell.com. The Company maintains a corporate governance page on the Company’s website. This page includes, among other items, the Code of Business Conduct, the Audit Committee Charter, the Compensation Committee Charter and the Corporate Governance and Nominating Committee Charter. The corporate governance information can be found at www.westell.com under Investors.
You should carefully consider the risks described below in addition to the other information contained and incorporated by reference in this Form 10-K. The risks described below are not the only risks facing us. Additional risks and uncertainties not currently known to us, or those risks we currently view to be immaterial, may also materially and adversely affect our business, operating results or financial condition. If any of these risks materialize, our business, operating results or financial condition could be materially and adversely affected.
Risks Related to Our Business
General economic conditions may affect our results.
The global economy continues to undergo a period of volatility, which has affected the demand for our equipment and services. A further economic decline could have a material adverse effect on our results of operations and financial condition. The Company may experience a decrease in purchases or usage of our products and services if economic conditions lead to lower utilization of telecommunications services. Customers may stop or decrease purchasing due to efforts to reduce inventory and conserve cash. The Company may also experience business disruptions due to an inability to obtain equipment, parts and supplies from suppliers if fragile supply businesses fail.
We have incurred losses in the past and may incur losses in the future.
We have incurred losses in fiscal years ended March 31, 2013, 2009 and 2008 and historically in fiscal years though 2002. The Company had an accumulated deficit of $242.9 million as of March 31, 2013.
We also expect to continue to evaluate new product and growth opportunities. As a result, we will continue to invest in research and development and sales and marketing, which could adversely affect our short-term operating results. We cannot provide any certainty that we will be profitable in the future.
We depend on a limited number of customers who are able to exert a high degree of influence over us and loss of a major customer could adversely impact our business.
We have and may continue to depend on U.S. telecommunication service providers for the majority of our revenues. The telecommunications companies and our other customers are significantly larger than we are and are able to exert a high degree of influence over us. These customers may often be permitted to reschedule orders without penalty. Even if demand for our products is high, many telecommunication service providers have sufficient bargaining power to demand low prices and other terms and conditions that may materially adversely affect our business and operating results.
Overall sales and product mix sold to our large customers have fluctuated in the past and could vary in the future resulting in significant fluctuations in quarterly operating results which may adversely impact our stock price.
We have completed acquisitions and may engage in future acquisitions that could impact our financial results or stock price.
Our growth strategy includes acquisitions. We recently completed two acquisitions and expect to continue to review potential acquisitions, and we may acquire or make investments in businesses, products or technologies in the future. Any existing or substantial future acquisitions or investments would present a number of risks that could harm our business including:
| |
• | business integration issues; |
| |
• | disruption to our ongoing or our acquired business; |
| |
• | difficulty realizing the intended benefits of the transaction; and |
| |
• | impairment of assets related to acquired goodwill and intangibles. |
Future acquisitions or investments could also result in use of significant cash balances, potential dilutive issuances of equity securities or incurrence of debt, contingent liabilities or amortization expenses related to goodwill and other intangible assets, any of which could adversely affect our financial condition and results of operations.
We have long-term customer pricing contracts with a limited amount of coverage by way of long-term contracts or arrangements with suppliers, which could adversely affect our ability, with certainty or economically, to purchase components and technologies used in our products.
Although we have long-term customer pricing contracts, we have few long-term contracts or arrangements with our suppliers. We may not be able to obtain products or components at competitive prices, in sufficient quantities or under other commercially reasonable terms. We may be unable to pass any significant increase in product costs on to our customers, which could have an adverse impact on our financial results.
Our lack of backlog may affect our ability to adjust for unexpected changes in customer demand.
Customers often place orders for product within the month of their requested delivery date. We therefore typically do not have a material backlog (or known quantity) of unfilled orders, and our revenues in any quarter are substantially dependent on orders booked or orders becoming non-cancellable in that quarter. Our expense levels and inventory commitments are based on anticipated customer demand and are relatively fixed in the short term. If we enter into a high-volume or long-term supply arrangement and subsequently decide that we cannot use the products or services provided for in the supply arrangement then
our business would also be harmed. We enter into short-term contracts with our suppliers in the form of purchase orders. These purchase orders are issued to vendors based on forecasted customer demand. Therefore, we may be unable to cancel purchase orders with our suppliers or adjust spending in a timely manner to compensate for any unexpected shortfall of orders. Accordingly, any significant shortfall of demand in relation to our expectations or any material delay of customer orders could have an adverse impact on our business, operating and financial results.
Conversely, if we order too little product to meet customer demand, we may have insufficient inventory which could result in unplanned expediting costs or lost revenue opportunities, either of which could have an adverse impact on our financial results.
We may experience delays in the development and deployment of new products.
Many of our past sales have resulted from our ability to anticipate changes in technology, industry standards and service provider service offerings, and to develop and introduce new and enhanced products and services. Our continued ability to adapt to such changes will be a significant factor in maintaining or improving our competitive position and our prospects for growth.
There can be no assurance that we will successfully introduce new products on a timely basis or achieve sales of new products in the future. In addition, there can be no assurance that we will have the financial and product design resources necessary to continue to successfully develop new products or to otherwise successfully respond to changing technology standards and service provider service offerings. If we fail to deploy new products on a timely basis, then our product sales will decrease and our competitive position and financial condition would be materially and adversely affected.
Our customers have lengthy purchase cycles and unpredictable purchasing practices that affect our ability to sell our products.
Prior to selling products to service providers, we must undergo lengthy approval and purchase processes. Evaluation can take as little as a few months for products that vary slightly from existing products or up to a year or more for products based on new technologies or utilized for new service offerings. Customers may also choose not to utilize our offerings. Accordingly, we are continually submitting successive generations of our current products as well as new products to our customers for approval.
The requirement that service providers obtain FCC or state regulatory approval for most new telecommunications and broadband services prior to their implementation has in the past delayed the approval process. Such delays in the future could have a material adverse affect on our business and operating results. While we have been successful in the past in obtaining product approvals from our customers, there is no guarantee that such approvals or that ensuing sales of such products will continue to occur.
Our business is subject to the risks of international operations.
We are dependent on our independent offshore manufacturing partners in Asia to manufacture, assemble and test our products. Although there typically is no unique capability with these suppliers, any failure or business disruption by these suppliers to meet delivery commitments would cause us to delay shipments and potentially lose revenue and/or incur contractual penalties. The reliance on third-party subcontractors for assembly of our products involves several risks, including the unavailability of, or interruptions in access to, certain process technologies and reduced control over product quality, delivery schedules, transportation, manufacturing yields, and costs. These risks may be exacerbated by economic or political uncertainties, terrorist actions, or by natural pandemics or other disasters in countries in which our subcontractors or their subcontractors are located. Contracts with our outsource manufacturing partners are generally expressed in U.S. dollars, but volatility in foreign currency rates could increase our costs.
As a result of the April 1, 2013, Kentrox acquisition, we expect to derive an increased portion of our revenue from international operations. As a result, our financial condition and operating results could be significantly affected by risks associated with international activities, such as tax laws, currency translation risks, and complex regulatory requirements as conditions of doing business. Requirements for international expansion may increase our operating expenses or working capital needs.
Due to the rapid pace of technological change and volatile customer demand, our products may become obsolete and could cause us to incur charges for excess and obsolete inventory which would materially harm our business.
The telecommunications industry is subject to rapid technological change and volatile customer demands, which affected our past results and could result in inventory obsolescence or excess inventory. We have in the past and may in the future devote disproportionate resources to a product that we ultimately may not sell or have to sell for a loss. If we incur substantial inventory impairments that we are not able to recover because of changing market conditions, or if we commit resources that
do not result in profitable sales, there could be a material adverse effect on our business, financial condition and results of operations.
Our products and services face intense competition. Our failure to compete successfully could materially affect our profitability.
Because we are smaller than many of our competitors, we may lack the financial, marketing, technical and other resources needed to increase or maintain our market share. Many of our competitors are larger than we are and may be able to offer a wider array of products and services required for a service provider’s business than we do.
Competitors may succeed in establishing more technologically advanced products and services, or products with more favorable pricing or may otherwise gain an advantage over our products which would result in lost business that would adversely impact our profitability.
Because of intense competition, we may price our products and services at low margins in order to win or maintain business. Low margins from our sales of products and services could materially and adversely affect our profitability and ability to achieve our business goals.
We are dependent on third-party technology, the loss of which would harm our business.
We rely on third parties for technology in our products. Consequently, the Company must rely upon third parties to develop and to introduce technologies which enhance the Company's current products and enable the Company, in turn, to develop its own products on a timely and cost-effective basis to meet changing customer needs and technological trends in the telecommunications industry. Were the Company to lose the ability to obtain needed technology from a supplier, or were that technology no longer available to the Company under reasonable terms and conditions, the Company’s business and results of operations could be materially and adversely affected.
Potential product recalls, service failures and warranty expenses could adversely affect our profitability.
Our products are required to meet rigorous standards imposed by our customers, and we warrant the performance of these products and services. In addition, our supply contracts with our major customers typically require us to accept returns of products within certain time frames and indemnify such customers against certain liabilities arising out of the use of our products or services. Complex products such as those offered by us may contain undetected defects or failures when first introduced or as new versions are released. Despite our testing of products and our comprehensive quality control program, there is no guarantee that our products will not suffer from defects or other deficiencies. If product defects, recalls, warranty returns, failures, indemnification or liquidated-damage claims exceed our anticipated costs for these items, our business could be harmed. Such claims and the associated negative publicity could result in the loss of or delay in market acceptance of our products and services, and could affect our product sales, our customer relationships, and our profitability.
We are dependent on sole or limited source suppliers, the loss of which would harm our business.
Components used in our products may be currently available from only one source or a limited number of suppliers. Our inabilities to obtain sufficient key components or to develop alternative sources for key components as required, could result in delays or reductions in product deliveries, and consequently severely harm our customer relationships and our business. Furthermore, additional sole-source components may be incorporated into our future products, thereby increasing our supplier risks. If any of our sole-source suppliers delay or halt production of any of their components, or fail to supply their components on commercially reasonable terms, then our business and operating results would be harmed.
In the event that these suppliers discontinue the manufacture of materials used in our products, we would be forced to incur the time and expense of finding a new supplier, if available, or to modify our products in such a way that such materials were not necessary, which could result in increased manufacturing costs.
New regulations related to conflict minerals could adversely impact our business.
The Dodd-Frank Wall Street Reform and Consumer Protection Act contains provisions concerning the supply of “conflict” minerals mined from the Democratic Republic of Congo and adjoining countries (“DRC”). As a result, the SEC established annual disclosure and reporting requirements for those companies who may use conflict minerals sourced from the DRC in their products. There will be costs associated with complying with these disclosure requirements, including diligence costs to determine the sources of conflict minerals used in our products. These new requirements also could limit the pool of suppliers who can provide conflict-free minerals and, as a result, we cannot ensure that we will be able to obtain these minerals at competitive prices. In addition, we may face challenges with our customers or with our reputation if we determine that certain
of our products contain minerals not determined to be conflict free or if we are unable to sufficiently verify the origins of the minerals used in our products.
We may be subject to litigation that could be costly to defend and could impact our profitability.
Our products use third party and open source intellectual property. The telecommunications industry is characterized by the existence of an increasing number of patents and frequent litigation based on allegations of patent and other intellectual property infringement. From time to time we receive communications from third parties alleging infringement of exclusive patent, copyright and other intellectual property rights to technologies that are important to us. Such litigation, regardless of its outcome, could result in substantial costs and thus adversely impact our profitability. We could face securities litigation or other litigation that could result in the payment of substantial damages or settlement costs in excess of our insurance coverage. Any adverse outcome could harm our business. Even if we were to prevail in any such litigation, we could incur substantial legal costs and management's attention and resources could be diverted from our business which could cause our business to suffer.
We will not be able to successfully compete, develop and sell products and services if we fail to retain key personnel and hire additional key personnel.
Because of our need to continually compete for customer business, our success is dependent on our ability to attract and retain qualified technical, marketing, sales and management personnel. To remain competitive, we must maintain top management talent, employees who are involved in product development and testing and employees who have developed strong customer relationships. Because of the high demand for these types of employees, it may be difficult to retain existing key employees and attract new key employees. In addition, we do not have non-compete contracts with most of our employees. Our inability to attract and retain key employees could harm our ability to successfully sell existing products, develop new products, and implement our business goals.
Industry consolidation and divestiture could make competing more difficult.
Consolidation of companies offering competing products is occurring through acquisitions, joint ventures and licensing arrangements involving our competitors, our customers and our customers’ competitors.
Our customers may acquire, merge or divest territories to other telecommunication service providers. The acquiring companies often use competitor products in their legacy business. We are often required to formally bid to retain existing business or obtain new business in the acquirer’s territory.
We cannot provide any assurances that we will be able to compete successfully in an increasingly consolidated telecommunications industry or retain or win business when existing customers divest portions of their business to others. Any heightened competitive pressures that we may face may have a material adverse effect on our business, prospects, financial condition and results of operations.
Utilization of our deferred tax assets could be limited by an ownership change as defined by Section 382 of the Internal Revenue Code, or by a change in the tax code, or by our ability to generate future taxable income.
We have significant deferred tax assets, primarily in the form of net operating losses, which are generally available to offset future taxable income. If we fail to generate sufficient future taxable income, net operating losses would expire prior to utilization. A valuation allowance was recorded against all deferred tax assets in the fourth quarter of fiscal year 2013. A change in ownership, as defined by Section 382 of the Internal Revenue Code, could reduce the availability of those tax assets. In addition, some tax jurisdictions such as Illinois and California have suspended the use of net operating losses to offset future taxable income for a period of time. Additional federal or state tax code changes could further limit our use of deferred tax assets and harm our business and our investors.
We have and may incur liabilities in connection with the sale of certain assets and discontinued operations.
In connection with our divestitures of ConferencePlus and substantially all of the assets of the CNS business, we have agreed to indemnify parties against specified losses with respect to those transactions and retained responsibility for various legal liabilities that may accrue. The indemnities relate to, among other things, liabilities which may arise with respect to the period during which we operated the divested business, and to certain ongoing contractual relationships and entitlements with respect to which we made commitments in connection with the divestiture. We have incurred and may incur additional expenses defending indemnity and third party claims. These added expenses to resolve the claim or to defend against the third party action could harm our operating results. In addition, such claims may divert management attention from our continuing business. It may also be difficult to determine whether a claim from a third party stemmed from actions taken by us or by another party and we may expend substantial resources trying to determine which party has responsibility for the claim.
Any restructuring activities that we may undertake may not achieve the benefits anticipated and could result in additional unanticipated costs, which could have a material adverse effect on our business, financial condition, cash flows or results of operations.
We regularly evaluate our existing operations and, as a result of such evaluations, may undertake restructuring activities within our business. These restructuring activities may involve higher costs or longer timetables than we anticipate, including costs related to severance and other employee-related matters, litigation risks and expenses, and other costs. These restructuring activities may disrupt sales or operations and may not result in improvements in future financial performance. If we incur unanticipated costs or are unable to realize the benefits related to restructuring activities, the activities could have a material adverse effect on our business, financial condition, cash flows or results of operations.
An impairment of goodwill or other intangible assets could adversely impact our reported financial results.
At least annually, we are required to test our goodwill to determine if impairment has occurred. Events or circumstances could arise that may create a need to record an impairment adjustment related to our goodwill or other intangible assets that could adversely impact our reported financial results. A goodwill impairment charge was recorded in the fourth quarter of fiscal year 2013 that reduced goodwill balances existing at that time to zero.
Our business may be affected by uncertain government regulation, and current or future laws or regulations could restrict the way we operate our business or impose additional costs on our business.
The telecommunications industry, including most of our customers, is subject to regulation from federal and state agencies, including the FCC and various state public utility and service commissions. While most such regulations do not affect us directly, the effects of regulations on our customers may adversely impact our business and operating results. For example, FCC regulatory policies affecting the availability of telecommunication company services and other terms on which telecommunication companies conduct their business may impede our penetration of local access markets, and/or make the markets less financially attractive.
Risks Related to our Common Stock
Our stock price is volatile and could drop unexpectedly.
Like many technology companies, our stock price has demonstrated and may continue to demonstrate volatility as valuations, trading volumes and prices vary significantly. Such volatility may result in a material decline in the market price of our securities, and may have little relationship to our financial results or prospects.
We could be the subject of future investigation by the SEC or other governmental authorities that could adversely affect our financial condition, results of operations and the price of our common stock.
In the event that an investigation by the SEC or other governmental authorities leads to significant legal expense or to action against the Company or its directors and officers, our financial condition, results of operations and the price of our common stock may be adversely impacted.
Our principal stockholders can exercise significant influence that could discourage transactions involving a change of control and may affect your ability to receive a premium for Class A Common Stock that you purchase.
As of May 14, 2013, as trustees of a voting trust dated February 23, 1994, (the “Voting Trust”) containing common stock held for the benefit of the Penny family, Robert C. Penny III and Robert W. Foskett have the exclusive power to vote over 51.4% of the votes entitled to be cast by the holders of our common stock. In addition, members of the Penny family who are beneficiaries under this Voting Trust are parties to a stock transfer restriction agreement which prohibits the beneficiaries from transferring any Class B Common Stock or their beneficial interests in the Voting Trust without first offering such Class B Common Stock to the other Penny family members. Certain Penny family members also own or are beneficiaries of trusts that own shares outside of the Voting Trust. As trustees of the Voting Trust and other trusts, Messrs. Penny and Foskett control 55.4% of the stock vote. Consequently, we are effectively under the control of Messrs. Penny and Foskett, as trustees, who can effectively control the election of all of the directors and determine the outcome of most corporate transactions or other matters submitted to the stockholders for approval. Such control may have the effect of discouraging transactions involving an actual or potential change of control, including transactions in which the holders of Class A Common Stock might otherwise receive a premium for their shares over the then-current market price.
|
| |
ITEM 1B. | UNRESOLVED STAFF COMMENTS |
None.
The Company leases the following real property:
|
| | | | | | |
Location | Purpose | | Square footage | | Termination year |
Aurora, IL | Office, distribution and manufacturing | | 185,000 |
| | 2017 |
Regina, Saskatchewan, Canada | Office, sales and R&D | | 2,500 |
| | 2017 |
Goleta, CA | Office and R&D | | 2,611 |
| | 2013 |
The Aurora facility is used for its corporate headquarters, product distribution, and warranty processing. In November 2012, the company entered into a site license to sublease a portion of the Aurora facility to a third party through May 31, 2013, with a subsequent month-to-month option. Alternative uses are currently being explored for portions of the Aurora facility that exceed the Company’s requirements.
On April 1, 2013, as a result of the Kentrox acquisition, the Company acquired a 16 acre parcel of land in Dublin, Ohio. Additionally, Kentrox leases 13,000 square feet of office and manufacturing space in Dublin, Ohio. This lease terminates December 31, 2013.
The Company is involved in various legal proceedings incidental to the Company’s business and its previously owned operations. In the ordinary course of our business, we are routinely audited and subject to inquiries by governmental and regulatory agencies. Although it is not possible to predict with certainty the outcome of these or other unresolved legal actions or the range of possible loss, management believes that the outcome of such proceedings will not have a material adverse effect on our consolidated operations or financial condition.
|
| |
ITEM 4. | MINE SAFETY DISCLOSURES |
Not Applicable.
PART II
|
| |
ITEM 5. | MARKET FOR REGISTRANT’S COMMON EQUITY, RELATED STOCKHOLDER MATTERS AND ISSUER PURCHASES OF EQUITY SECURITIES |
The Company’s Class A Common Stock is quoted on the NASDAQ Global Select Market under the symbol “WSTL”. The following table sets forth for the periods indicated the high and low sale prices for the Class A Common Stock as reported on the NASDAQ Global Select Market.
|
| | | | | | | |
| High | | Low |
Fiscal Year 2013 | | | |
First Quarter ended June 30, 2012 | $ | 2.46 |
| | $ | 2.10 |
|
Second Quarter ended September 30, 2012 | 2.40 |
| | 1.93 |
|
Third Quarter ended December 31, 2012 | 2.20 |
| | 1.73 |
|
Fourth Quarter ended March 31, 2013 | 2.17 |
| | 1.75 |
|
Fiscal Year 2012 | | | |
First Quarter ended June 30, 2011 | $ | 3.93 |
| | $ | 3.16 |
|
Second Quarter ended September 30, 2011 | 3.61 |
| | 2.09 |
|
Third Quarter ended December 31, 2011 | 2.52 |
| | 1.94 |
|
Fourth Quarter ended March 31, 2012 | 2.52 |
| | 2.18 |
|
As of May 14, 2013, there were approximately 575 holders of record of the outstanding shares of Class A Common Stock and five holders of record of Class B Common Stock.
During the fiscal year ended March 31, 2013, no equity securities of the Company were sold by the Company that were not registered under the Securities Act of 1933, as amended.
Dividends
The Company has never declared or paid any cash dividends on its common stock and does not anticipate paying any cash dividends in the foreseeable future.
Issuer Purchases of Equity Securities
The following table provides information about the Company’s repurchase activity for its Class A Common Stock during the three months ended March 31, 2013.
|
| | | | | | | | | | | | | |
Period | Total Number of Shares Purchased (a) | | Average Price Paid per Share (b) | | Total Number of Shares Purchased as Part of Publicly Announced Programs (c) | | Maximum Number (or Approximate Dollar Value) that May Yet Be Purchased Under the Programs (c) |
January 1-31, 2013 | 17,650 |
| | $ | 1.9048 |
| | 17,650 |
| | $ | 112,741 |
|
February 1-28, 2013 | — |
| | $ | — |
| | — |
| | $ | 112,741 |
|
March 1-31, 2013 | 9,412 |
| | $ | 1.8300 |
| | — |
| | $ | 112,741 |
|
Total | 27,062 |
| | $ | 1.8886 |
| | 17,650 |
| | $ | 112,741 |
|
| |
(a) | In March 2013, the Company repurchased 9,412 shares from an executive that were surrendered to satisfy the minimum statutory tax withholding obligations on the vesting of restricted stock units. These repurchases were not included in the authorized share repurchase program and had a weighted-average purchase price of $1.83 per share. |
| |
(b) | Average price paid per share includes commissions. |
| |
(c) | In August 2011, the Board of Directors authorized a share repurchase program whereby the Company could repurchase up to an additional aggregate of $20.0 million of its outstanding Class A Common Stock. |
Performance Graph
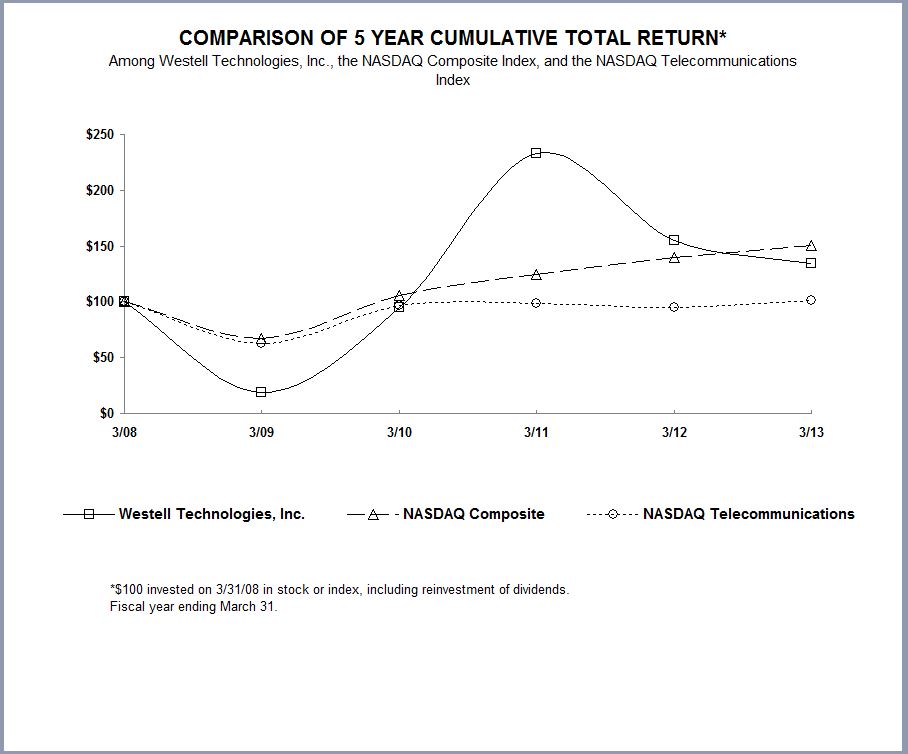
The following performance graph compares the change in the Company’s cumulative total stockholder return on its Class A Common Stock with the cumulative total return of the NASDAQ Composite Index and the NASDAQ Telecommunications Index for the period commencing March 31, 2008 and ending March 31, 2013. The stock price performance shown in the performance graph may not be indicative of future stock performance price.
|
| | | | | | | | | | | | | | | | | |
| 3/08 | | 3/09 | | 3/10 | | 3/11 | | 3/12 | | 3/13 |
Westell Technologies, Inc. | 100.00 |
| | 18.67 |
| | 94.67 |
| | 233.33 |
| | 155.33 |
| | 134.00 |
|
NASDAQ Composite | 100.00 |
| | 67.15 |
| | 105.94 |
| | 124.71 |
| | 139.71 |
| | 150.83 |
|
NASDAQ Telecommunications | 100.00 |
| | 62.46 |
| | 96.85 |
| | 98.99 |
| | 95.20 |
| | 101.20 |
|
|
| |
ITEM 6. | SELECTED FINANCIAL DATA |
The following selected consolidated financial data as of March 31, 2013, 2012, 2011, 2010 and 2009 and for each of the five fiscal years in the period through fiscal year 2013 have been derived from the Company's Consolidated Financial Statements. The Company sold its ConferencePlus subsidiary in fiscal year 2012 and is reporting the results of ConferencePlus as discontinued operations. The data set forth below is qualified by reference to, and should be read in conjunction with, "Management's Discussion and Analysis of Financial Condition and Results of Operations”, the Consolidated Financial
Statements and the related Notes thereto and other financial information appearing elsewhere in this Annual Report on Form 10-K.
|
| | | | | | | | | | | | | | | | | | | |
(in thousands, except per share data) | Fiscal Year Ended March 31, |
Statement of Operations Data: | 2013 | | 2012 | | 2011 | | 2010 | | 2009 |
Revenue | $ | 40,044 |
| | $ | 69,655 |
| | $ | 147,849 |
| | $ | 139,764 |
| | $ | 140,714 |
|
Cost of goods sold | 25,720 |
| | 46,398 |
| | 106,297 |
| | 102,374 |
| | 109,762 |
|
Gross profit | 14,324 |
| | 23,257 |
| | 41,552 |
| | 37,390 |
| | 30,952 |
|
Operating expenses: | | | | | | | | | |
Sales and marketing | 7,439 |
| | 6,496 |
| | 10,813 |
| | 10,770 |
| | 14,929 |
|
Research and development | 7,326 |
| | 7,727 |
| | 11,774 |
| | 11,363 |
| | 17,633 |
|
General and administrative | 9,910 |
| | 7,615 |
| | 8,623 |
| | 9,020 |
| | 12,151 |
|
Intangible amortization | 892 |
| | 548 |
| | 545 |
| | 529 |
| | 1,820 |
|
Restructuring | 149 |
| | 550 |
| | — |
| | 460 |
| | 591 |
|
Goodwill impairment | 2,884 |
| | — |
| | — |
| | — |
| | 1,381 |
|
Total operating expenses | 28,600 |
| | 22,936 |
| | 31,755 |
| | 32,142 |
| | 48,505 |
|
Operating income (loss) from continuing operations | (14,276 | ) | | 321 |
| | 9,797 |
| | 5,248 |
| | (17,553 | ) |
Gain on CNS asset sale | — |
| | 31,654 |
| | — |
| | — |
| | — |
|
Other income (expense), net | 175 |
| | 331 |
| | 20 |
| | 13 |
| | 791 |
|
Income (loss) from continuing operations before income tax | (14,101 | ) | | 32,306 |
| | 9,817 |
| | 5,261 |
| | (16,762 | ) |
Income tax (expense) benefit | (29,392 | ) | | (12,875 | ) | | 53,304 |
| | 814 |
| | 21 |
|
Net income (loss) from continuing operations | (43,493 | ) | | 19,431 |
| | 63,121 |
| | 6,075 |
| | (16,741 | ) |
Gain on sale of discontinued operations, net of tax expense of $12,359 | — |
| | 20,489 |
| | — |
| | — |
| | — |
|
Income (loss) from discontinued operations, net of tax expense (benefit) of $(813), $1,447, $53, $256 and $98, respectively | (545 | ) | | 2,062 |
| | 4,815 |
| | 4,252 |
| | 147 |
|
Net income (loss) | $ | (44,038 | ) | | $ | 41,982 |
| | $ | 67,936 |
| | $ | 10,327 |
| | $ | (16,594 | ) |
Basic net income (loss) per share: | | | | | | | | | |
Basic net income (loss) from continuing operations | $(0.73) | | $0.29 | | $0.93 | | $0.09 | | $(0.24) |
Basic net income (loss) from discontinued operations | (0.01) | | 0.34 | | 0.07 | | 0.06 | | 0.01 |
Basic net income (loss) per share* | $(0.73) | | $0.63 | | $1.00 | | $0.15 | | $(0.24) |
Average number of basic common shares outstanding | 59,944 |
| | 66,657 |
| | 67,848 |
| | 67,987 |
| | 69,470 |
|
Diluted net income (loss) per share: | | | | | | | | | |
Diluted net income (loss) from continuing operations | $(0.73) | | $0.29 | | $0.91 | | $0.09 | | $(0.24) |
Diluted net income (loss) from discontinued operations | (0.01) | | 0.33 | | 0.07 | | 0.06 | | 0.01 |
Diluted net income (loss) per share* | $(0.73) | | $0.62 | | $0.98 | | $0.15 | | $(0.24) |
Average number of diluted common shares outstanding | 59,944 |
| | 67,979 |
| | 69,477 |
| | 68,573 |
| | 69,470 |
|
Balance Sheet Data (at end of period): | | | | | | | | | |
Cash and cash equivalents | $ | 88,233 |
| | $ | 120,832 |
| | $ | 86,408 |
| | $ | 61,315 |
| | $ | 46,058 |
|
Working capital ** | 12,637 |
| | 12,461 |
| | 29,457 |
| | 17,959 |
| | 19,001 |
|
Total assets | 145,172 |
| | 197,426 |
| | 201,387 |
| | 121,834 |
| | 115,564 |
|
Total stockholders’ equity | $ | 131,077 |
| | $ | 186,364 |
| | $ | 159,281 |
| | $ | 87,731 |
| | $ | 76,448 |
|
*Per share may not sum to totals because of rounding.
**Working capital is defined as current assets less cash and cash equivalents, restricted cash, short-term investments and current liabilities.
See Note 1 for additional information on the recent acquisitions and divestitures.
|
| |
ITEM 7. | MANAGEMENT'S DISCUSSION AND ANALYSIS OF FINANCIAL CONDITION AND RESULTS OF OPERATIONS |
Overview
The following discussion should be read together with the Consolidated Financial Statements and the related Notes thereto and other financial information appearing elsewhere in this Form 10-K. All references herein to the term “fiscal year” shall mean a year ended March 31 of the year specified.
The Company commenced operations in 1980 as a provider of telecommunications network transmission products that enable advanced telecommunications services over copper telephone wires. The Company currently has two reportable segments: Westell and Customer Networking Solutions ("CNS"). Until fiscal 1994, the Company derived substantially all of its revenues from its Westell segment products, particularly the sale of Network Interface Unit (“NIU”) products and related products. The Company introduced its first CNS products in fiscal 1993. The Company also provided audio teleconferencing services from fiscal 1989 until Conference Plus, Inc was sold on December 31, 2011. The Company realizes the majority of its revenues from the North American market.
On April 1, 2013, the Company acquired Kentrox, Inc. ("Kentrox") for $30.0 million, subject to an adjustment for working capital. Kentrox is a worldwide leader in intelligent site management solutions. The Company expects to report Kentrox as a separate segment during fiscal year 2014. The acquisition qualifies as a business combination and will be accounted for from the date of acquisition using the acquisition method of accounting.
On May 15, 2012, the Company acquired certain assets and liabilities of ANTONE Wireless Corporation (“ANTONE”), including rights to ANTONE products, for $2.5 million cash, subject to an adjustment for working capital, plus contingent cash consideration of up to an additional $3.5 million. The contingent consideration is based upon profitability of the acquired products for post-closing periods through June 30, 2016, and may be offset by working capital adjustments and indemnification claims. The acquisition included inventories, property and equipment, contract rights, customer relationships, technology, and certain specified operating liabilities that existed at the closing date. The Company hired nine of ANTONE’s employees. ANTONE products include high-performance tower-mounted amplifiers, multi-carrier power amplifier boosters, and cell-site antenna sharing products. The acquisition qualifies as a business combination and has been accounted for using the acquisition method of accounting from the date of acquisition.
On December 31, 2011, the Company sold its wholly owned subsidiary, Conference Plus, Inc. including Conference Plus Global Services, Ltd (“CGPS”), a wholly owned subsidiary of ConferencePlus (collectively, “ConferencePlus”) to Arkadin for $40.3 million in cash (the “ConferencePlus sale”). Of the total purchase price, $4.1 million was placed in escrow at closing for one year as security for certain indemnity obligations of the Company. The Company subsequently agreed to extend the escrow period to June 10, 2013. During the three months ended December 31, 2012, the Company recorded a contingent liability of $1.5 million, pre-tax, relating to impending claims raised by Arkadin under the indemnity provisions of the purchase sales agreement. In the quarter ended March 31, 2013, $1.6 million of the escrow was released. The Company expects the cash held in escrow that is in excess of the obligation covered by the indemnity provisions to be released to the Company during fiscal year 2014.
On April 15, 2011, the Company sold certain assets and transferred certain liabilities of the CNS segment to NETGEAR, Inc. for $36.7 million in cash (the “CNS asset sale”). As part of the CNS asset sale, most of the CNS segment’s customer relationships, contracts and employees were transferred to NETGEAR. The Company retained a major CNS customer relationship and contract. The Company completed the remaining contracted product shipments under this contract in December 2011. During the first three quarters of fiscal year 2013, the Company continued to provide warranty services under its contractual obligations and to sell ancillary products and software on a project basis to the retained customer. The Company expects no CNS activity with that retained customer going forward. The Company also retained the Homecloud product development program. The Homecloud product family aims to provide a new suite of services into the home, with an initial focus on media and information management, sharing and delivery, and with prospective functionality applicable to enhanced security, home control, and network management.
In the Westell segment, the Company designs, distributes, markets and services a broad range of carrier-class products. The Company’s Westell product family consists of indoor and outdoor cabinets, enclosures and mountings; power distribution products; network interface devices (“NIDs”) for TDM/SONET networks and service demarcation; span powering equipment; remote monitoring devices; copper/fiber connectivity panels; managed Ethernet switches for utility and industrial networks; Ethernet extension devices for providing native Ethernet service handoff in carrier applications; wireless signal conditioning and monitoring products for cellular networks; tower-mounted amplifiers; cell site antenna-sharing products for cell site
optimization; and custom systems integration (“CSI”) services. Legacy products are sold primarily into wireline markets, but the Company also is actively moving to develop revenues from wireless telecommunications products. In the quarter ended September 30, 2012, the Company completed the relocation of the production of power distribution and remote monitoring products, which were manufactured at the Company’s Noran Tel subsidiary located in Regina, Saskatchewan, Canada, to its location in Aurora, Illinois. The remaining operations in Regina, Canada, are focused on power distribution product development and on sales of Westell products in Canada. Effective as of April 1, 2013 with the acquisition of Kentrox, the Company designs, distributes, markets and services intelligent site management solutions, which provide comprehensive monitoring, management and control of a broad range of devices. The machine-to-machine (M2M) communications Kentrox provides enable service providers, tower operators, and other network operators to reduce operating costs while improving network performance. The Company provides a suite of Remote monitoring and control devices, which when combined with its Optima management system provide a comprehensive, bi-directional solution. The Kentrox solution addresses customer needs such as power management (generator management, battery, fuel, and rectifier monitoring, tenant power metering, etc.), environmental management (HVAC monitoring, energy monitoring and control, aircraft warning light management, and environmental monitoring), security management (access management, asset tampering, and surveillance), and communications management (microwave and distributed antenna systems management). Customers include major wireless and fixed-line telecommunications carriers, tower providers, cable and broadband network providers, utility companies, and enterprises. Kentrox provides solutions to customers in North and South America, Australia, Africa, and Europe.
The prices for the Company's products vary based upon volume, customer specifications and other criteria, and they are subject to change for a variety of reasons, including cost and competitive factors.
The Company’s customer base for its products is highly concentrated and comprised primarily of major telecommunications service providers, independent domestic local exchange carriers and public telecom administrations located in the U.S. and Canada. Due to the stringent quality specifications of its customers and the regulated environment in which its customers operate, the Company must undergo lengthy approval and procurement processes prior to selling most of its products. Accordingly, the Company must make significant up-front investments in product and market development prior to actual commencement of sales of new products.
To remain competitive, the Company must continue to invest in new product development and in targeted sales and marketing efforts to launch new product lines. Failure to increase revenues from new products, whether due to lack of market acceptance, competition, technological change meeting technical specifications or otherwise, could have a material adverse effect on the Company's business and results of operations. The Company expects to continue to evaluate new product opportunities and invest in product research and development activities.
In view of the Company’s reliance on the telecommunications market for revenues and the unpredictability of orders and pricing pressures, the Company believes that period-to-period comparisons of its financial results are not necessarily meaningful and should not be relied upon as an indication of future performance. The Company has experienced quarterly fluctuations in customer ordering and purchasing activity that appear to result from seasonal factors, including reductions in order volume and product deliveries for outdoor equipment as colder months approach and occur, and including the effects of customer vacation, budgeting and procurement patterns toward the end of the calendar year which may cause reductions or increases in activity. This seasonality can result in weaker revenue primarily in the third quarter of the fiscal year. The seasonal effects do not apply consistently and may not always correlate to financial results. Accordingly, they should not be considered a reliable indicator of our future revenue or results of operations.
Critical Accounting Policies
The preparation of financial statements in accordance with GAAP requires management to make use of certain estimates and assumptions that affect the reported amounts of assets and liabilities and the disclosure of contingent assets and liabilities at the date of the financial statements, and that affect the reported amounts of revenue and expenses during the reported periods. The Company bases estimates on historical experience and on various other assumptions that management believes are reasonable under the circumstances. These estimates and assumptions form the basis for judgments about carrying values of assets and liabilities that may not be readily apparent from other sources. Actual results could differ from the amounts reported.
In Note 2 to the consolidated financial statements, the Company includes a discussion of its significant accounting policies. The Company believes the following are the most critical accounting policies and estimates used in the preparation of the financial statements. The Company considers an accounting policy or estimate to be critical if it requires assumptions to be made concerning uncertainties, and if changes in these assumptions could have a material impact on financial condition or results of operations.
Business Combinations
The Company applies the guidance of ASC topic 805, Business Combinations. This guidance requires the acquiring entity in a business combination to recognize the fair value of assets acquired and liabilities assumed in transaction; establish the acquisition date fair value as the measurement objective for all assets acquired and liabilities assumed; requires expensing of transaction and restructuring costs; and requires the acquirer to disclose the information needed to evaluate and understand the nature and financial effect of the business combination.
Inventory Valuation
The Company reviews inventory for excess quantities and obsolescence based on its best estimates of future demand, product lifecycle status and product development plans. The Company uses historical information along with these future estimates to reserve for obsolete and potentially obsolete inventory. The Company also evaluates inventory to adjust valuations to be the lower of cost or market value. Prices anticipated for future inventory demand are compared to current and committed inventory values.
Inventory Purchase Commitments
In the normal course of business, the Company enters into non-cancellable commitments for the purchase of inventory. The commitments are negotiated to be at market rates. Should there be a significant decline in revenues the Company may absorb excess inventory and subsequent losses as a result of these commitments. The Company establishes reserves for potential losses on at-risk commitments.
Income Taxes
The Company accounts for income taxes under the provisions of ASC topic 740, Income Taxes (“ASC 740”). ASC 740 requires an asset and liability based approach in accounting for income taxes. Deferred income tax assets, including net operating loss (“NOL”) and certain tax credit carryovers and liabilities, are recorded based on the differences between the financial statement and tax bases of assets and liabilities, applying enacted statutory tax rates in effect for the year in which the tax differences are expected to reverse. Valuation allowances are provided against deferred tax assets which are assessed as not likely to be realized. On a quarterly basis, management evaluates the recoverability of deferred tax assets and the need for a valuation allowance. This evaluation requires the use of estimates and assumptions and considers all positive and negative evidence and factors, such as the scheduled reversal of temporary differences, the mix of earnings in the jurisdictions in which the Company operates, and prudent and feasible tax planning strategies. Deferred tax assets and liabilities are adjusted for the effects of changes in tax laws and rates on the dates of enactment. The Company accounts for unrecognized tax benefits based upon its assessment of whether a tax benefit is more likely than not to be sustained upon examination by tax authorities. The Company reports a liability for unrecognized tax benefits resulting from unrecognized tax benefits taken or expected to be taken in a tax return and recognizes interest and penalties, if any, related to its unrecognized tax benefits in income tax expense. See Note 3 for further discussion of the Company’s income taxes.
Goodwill and Other Intangibles
Goodwill is not amortized, but it is tested for impairment at the reporting unit level by first performing a qualitative approach to test goodwill for impairment to determine whether it is more likely than not that the fair value of a reporting unit is less than its carrying value. If it is concluded that this is the case, it is necessary to perform the two-step, quantitative, goodwill impairment test. Otherwise, the two-step goodwill impairment test is not required.
Goodwill and indefinite-lived intangible assets are reviewed for impairment at least annually or when an event occurs or circumstances change between annual tests that would more likely than not reduce the fair value of the reporting unit below its carrying value. The Company performs its annual impairment test in the fourth quarter of each fiscal year and begins with a qualitative assessment to determine if it is more likely than not that the fair value of a reporting unit is less than its carrying value.
If the Company concludes that it is more likely than not that the fair value of a reporting unit is less than its carrying value, it is necessary to perform a two-step goodwill impairment test. The first step tests for impairment by applying fair value-based tests at the reporting unit level. Fair value of a reporting unit is determined by using both an income approach and a market approach, because this combination is considered to produce the most reasonable indication of fair value in an orderly transaction between market participants. Under the income approach, the Company determines fair value based on estimated future cash flows of a reporting unit, discounted by an estimated weighted-average cost of capital, which reflects the level of risk inherent in a reporting unit and its associated estimates of future cash flows as well as the rate of return an experienced investor might expect to earn. Under the market approach, the Company utilizes valuation multiples derived from publicly
available information for comparable companies to provide an indication of how much a knowledgeable investor in the marketplace might be willing to pay for a company. The second step (if necessary) measures the amount of impairment by applying fair-value-based tests to individual assets and liabilities within each reporting unit.
If the Company concludes that it is more likely than not that the fair value of an indefinite-lived intangible asset is less than its carrying value, a quantitative fair value assessment is performed and compared to the carrying value. If the fair value is less than the carrying value, impairment is recorded.
Intangible assets with determinable lives are amortized on a straight-line basis over their respective estimated useful lives. If the Company were to determine that a change to the remaining estimated useful life of an intangible asset was necessary, then the remaining carrying amount of the intangible asset would be amortized prospectively over that revised remaining useful life. On an ongoing basis, the Company reviews intangible assets with a definite life and other long-lived assets other than goodwill for impairment whenever events and circumstances indicate that carrying values may not be recoverable. If such events or changes in circumstances occur, the Company will recognize an impairment loss if the undiscounted future cash flow expected to be generated by the asset is less than the carrying value of the related asset. Any impairment loss would adjust the asset to its implied fair value.
Revenue Recognition
The Company records revenue from sales transactions when title and risk of loss are passed to the customer, there is persuasive evidence of an arrangement for sale, delivery has occurred and/or services have been rendered, the sales price is fixed or determinable, and collectability is reasonably assured.
Revenue recognition on equipment where software is incidental to the product as a whole, or where software is essential to the equipment’s functionality and falls under software accounting scope exceptions, generally occurs when products are shipped, risk of loss has transferred to the customer, objective evidence exists that customer acceptance provisions have been met, no significant obligations remain, collection is reasonably assured and warranty can be estimated.
Where multiple element arrangements exist, fair value of each element is established using the relative selling price method, which requires the Company to use vendor-specific objective evidence (“VSOE”), reliable third-party objective evidence (“TPE”) or management’s best estimate of selling price, in that order.
Stock–based Compensation
The Company recognizes stock-based compensation expense for all employee stock-based payments based upon the fair value on the award’s grant date over the requisite service period. Determining the fair value of equity-based options requires the Company to estimate the expected volatility of its stock, the risk-free interest rate, expected option term, expected dividend yield and expected forfeitures.
Product Warranties
Most of the Company’s products carry a limited warranty of up to seven years. The Company accrues for estimated warranty costs as products are shipped based on historical sales and cost of repair or replacement trends relative to sales.
New Accounting Standards Adopted
In July 2012, the FASB issued ASU No. 2012-02, Intangibles-Goodwill and Other (topic 350): Testing Indefinite-Lived Intangible Assets for Impairment (“ASU 2012-02”). ASU 2012-02 provides entities with an option to first assess qualitative factors to determine whether events or circumstances indicate that it is more likely than not that the indefinite-lived intangible asset is impaired. If an entity concludes that it is more than 50% likely that an indefinite-lived intangible asset is not impaired, no further analysis is required. However, if an entity concludes otherwise, it would be required to determine the fair value of the indefinite-lived intangible asset to measure the amount of actual impairment, if any, as currently required under the accounting principles generally accepted in the United States ("GAAP"). ASU 2012-02 is effective for fiscal years beginning after September 15, 2012. The adoption of this pronouncement did not materially impact the Company’s financial condition or results of operations.
Results of Operations
Fiscal Years Ended March 31, 2013, 2012 and 2011
|
| | | | | | | | | | | | | | | | | | | |
Revenue | Fiscal Year Ended March 31, | | Increase (Decrease) |
(in thousands) | 2013 | | 2012 | | 2011 | | 2013 vs. 2012 | | 2012 vs. 2011 |
Westell | $ | 38,808 |
| | $ | 43,629 |
| | $ | 58,770 |
| | $ | (4,821 | ) | | $ | (15,141 | ) |
CNS | 1,236 |
| | 26,026 |
| | 89,079 |
| | (24,790 | ) | | (63,053 | ) |
Consolidated revenue | $ | 40,044 |
| | $ | 69,655 |
| | $ | 147,849 |
| | $ | (29,611 | ) | | $ | (78,194 | ) |
In fiscal year 2013, consolidated revenue decreased 43% compared to fiscal year 2012. The 11% decrease in the Westell segment resulted primarily from lower demand for legacy products, as a result of a shift from T1 to Ethernet technology for the backhaul of cellular traffic and customer programs to constrain spending, manage inventory levels, and reuse of decommissioned products. The decrease in CNS revenue was due to the CNS asset sale, which closed on April 15, 2011, and the deliberate wind-down of CNS business transacted with the sole customer remaining thereafter. The Company expects no CNS activity with that retained customer going forward.
In fiscal year 2012, consolidated revenue decreased 53% compared to the prior year. The 26% decrease in Westell segment revenue was due primarily to lower demand that the Company believes resulted from a combination of factors, including a technology shift from T1 to Ethernet for the backhaul of cellular traffic, customer inventory management and reuse programs, customer budget constraints, and effects of the Verizon strike which occurred in the quarter ended September 30, 2011. CNS segment revenue decreased 71% due primarily to the CNS asset sale. CNS segment revenue in fiscal year 2012 contained $1.0 million that was realized prior to the April 15, 2011, closing date and related to customers that transferred with the CNS asset sale. The remaining CNS revenue is from a single customer that did not transfer with the sale and represents revenue from modem, gateway, and ancillary products and from product screening, software projects and other services.
|
| | | | | | | | | | | | | | | | | | | |
Gross profit and margin | Fiscal Year Ended March 31, | | Increase (Decrease) |
(in thousands) | 2013 | | 2012 | | 2011 | | 2013 vs. 2012 | | 2012 vs. 2011 |
Westell | $ | 13,325 |
| | $ | 17,272 |
| | $ | 25,667 |
| | $ | (3,947 | ) | | $ | (8,395 | ) |
| 34.3 | % | | 39.6 | % | | 43.7 | % | | (5.3 | )% | | (4.1 | )% |
CNS | 999 |
| | 5,985 |
| | 15,885 |
| | (4,986 | ) | | (9,900 | ) |
| 80.8 | % | | 23.0 | % | | 17.8 | % | | 57.8 | % | | 5.2 | % |
Consolidated gross profit | $ | 14,324 |
| | $ | 23,257 |
| | $ | 41,552 |
| | $ | (8,933 | ) | | $ | (18,295 | ) |
Consolidated gross margin | 35.8 | % | | 33.4 | % | | 28.1 | % | | 2.4 | % | | 5.3 | % |
In fiscal year 2013, consolidated margin increased 2.4% compared to fiscal year 2012. Westell segment gross margin decreased 5.3% year-over-year. The decrease was primarily because of higher excess and obsolete inventory charges and lower absorption of overhead costs due to lower revenue. Fiscal year 2013 included a $1.0 million charge for excess and obsolete inventory compared to a $0.6 million charge in fiscal year 2012. The inventory charges resulted primarily from the technology shift that decreased demand for T1-related products.
CNS segment gross margin increased 57.8% compared to the prior year primarily due to high-margin project-based software revenue, which was the majority of the revenue in fiscal year 2013, compared to lower-margin product revenue, which was the majority of the revenue in fiscal year 2012.
In fiscal year 2012, consolidated gross margin increased 5.3% compared to fiscal year 2011. Westell segment gross margin decreased 4.1% because of disproportionately reduced sales of higher margin products and lower absorption of overhead costs. CNS segment gross margin increased 5.2% due primarily to higher sales of higher margin ancillary, screening and software products compared to lower margin device sales.
|
| | | | | | | | | | | | | | | | | | | |
Sales and marketing (“S&M”) | Fiscal Year Ended March 31, | | Increase (Decrease) |
(in thousands) | 2013 | | 2012 | | 2011 | | 2013 vs. 2012 | | 2012 vs. 2011 |
Westell | $ | 7,492 |
| | $ | 5,573 |
| | $ | 5,922 |
| | $ | 1,919 |
| | $ | (349 | ) |
CNS | (53 | ) | | 923 |
| | 4,891 |
| | (976 | ) | | (3,968 | ) |
Consolidated S&M expense | $ | 7,439 |
| | $ | 6,496 |
| | $ | 10,813 |
| | $ | 943 |
| | $ | (4,317 | ) |
Percentage of Revenue | 19 | % | | 9 | % | | 7 | % | | | | |
In fiscal year 2013, consolidated sales and marketing expense increased by 15% or $0.9 million compared to fiscal year 2012. Sales and marketing expense in the Westell segment increased 34% primarily due to higher compensation and related expenses which resulted from the addition of employees hired with the ANTONE acquisition, the addition of a Senior Vice President of Sales and Marketing and increased commission expense. Sales and marketing expense in the CNS segment decreased compared to the prior fiscal year due to the CNS asset sale. The reversal of expense in fiscal year 2013 resulted from adjustments in accrued warranty.
In fiscal year 2012, consolidated sales and marketing expense decreased 40% or $4.3 million compared to the prior year. Sales and marketing expense in the Westell segment decreased 6% resulting primarily from lower bonus and commission expenses caused by decreased Westell segment revenue in fiscal year 2012 compared to fiscal year 2011. Sales and marketing expense in the CNS segment decreased 81% due to the CNS asset sale. CNS segment expenses in fiscal year 2012 are primarily for management, shipping and warranty costs for the one CNS remaining customer, plus limited marketing costs related to the Homecloud product.
|
| | | | | | | | | | | | | | | | | | | |
Research and development (“R&D”) | Fiscal Year Ended March 31, | | Increase (Decrease) |
(in thousands) | 2013 | | 2012 | | 2011 | | 2013 vs. 2012 | | 2012 vs. 2011 |
Westell | $ | 5,725 |
| | $ | 5,117 |
| | $ | 3,825 |
| | $ | 608 |
| | $ | 1,292 |
|
CNS | 1,601 |
| | 2,610 |
| | 7,949 |
| | (1,009 | ) | | (5,339 | ) |
Consolidated R&D expense | $ | 7,326 |
|
| $ | 7,727 |
| | $ | 11,774 |
| | $ | (401 | ) | | $ | (4,047 | ) |
Percentage of Revenue | 18 | % | | 11 | % | | 8 | % | | | | |
In fiscal year 2012, consolidated research and development expenses declined 34% or $4.0 million. Research and development in the Westell segment increased 34% or $1.3 million. The increase was due primarily to increased investment in the development of Ethernet and wireless products. Research and development expenses in the CNS segment decreased 67% due to the CNS asset sale. The Company continued to invest in Homecloud product development, the costs of which are included in the CNS segment as R&D expense.
|
| | | | | | | | | | | | | | | | | | | |
General and administrative (“G&A”) | Fiscal Year Ended March 31, | | Increase (Decrease) |
(in thousands) | 2013 | | 2012 | | 2011 | | 2013 vs. 2012 | | 2012 vs. 2011 |
Westell | $ | 4,401 |
| | $ | 2,834 |
| | $ | 2,023 |
| | $ | 1,567 |
| | $ | 811 |
|
CNS | 600 |
| | 976 |
| | 3,365 |
| | (376 | ) | | (2,389 | ) |
Unallocated corporate costs | 4,909 |
| | 3,805 |
| | 3,235 |
| | 1,104 |
| | 570 |
|
Consolidated G&A expense | $ | 9,910 |
| | $ | 7,615 |
| | $ | 8,623 |
| | $ | 2,295 |
| | $ | (1,008 | ) |
Percentage of Revenue | 25 | % | | 11 | % | | 6 | % | | | | |
In fiscal year 2013, G&A changed among segments and unallocated corporate costs primarily because of changes in allocations of such costs. For fiscal year 2013, the CNS segment absorbed only direct costs and the Westell segment absorbed
substantially all allocated G&A costs. In fiscal year 2012, certain operating expenses were allocated between the Westell and CNS segments, including rent, information technology costs, and accounting costs. The Westell and CNS segment received 72% and 28% of these resource costs in fiscal year 2012, respectively.
In fiscal year 2013, consolidated G&A expense increased 30% or $2.3 million. The CNS segment expense includes a $0.5 million expense related to a dispute with NETGEAR that was resolved in fiscal year 2013. The remaining increase in general and administrative expense, on a consolidated basis, resulted primarily from: increased personnel costs resulting from higher bonus and stock based compensation expense, the addition of a Vice President of Corporate Development; legal costs and acquisition costs relating to the Kentrox and ANTONE acquisitions; legal costs associated with the NETGEAR claim; and increased net expense for building rent resulting from a sublease that had reduced rent expense during fiscal year 2012, but not in fiscal year 2013.
In fiscal year 2012, consolidated G&A expense decreased 12% or $1.0 million. The Westell segment G&A expense increased 40% and the CNS segment G&A expense decreased 71%. The Westell and CNS segments shared G&A resources in fiscal years 2012 and 2011. The Westell segment received 72% and 38% of these resource costs and the CNS segment was allocated 28% and 62% of the costs in fiscal years 2012 and 2011, respectively. The Company determined allocation percentages by estimating G&A resources spent supporting each segment. G&A costs in the combined Westell and CNS segments were down due primarily to lower bonus expense and a decreased allocation of building rent expense. Rent associated with resources supporting the assets sold to NETGEAR was not reallocated between the segments and is reflected in unallocated corporate costs. In addition, in fiscal year 2011, the CNS segment incurred $0.8 million of expense for the defense and settlement costs of a patent infringement claim. In fiscal year 2012, unallocated corporate G&A expense increased by 18%. The increase resulted primarily from increased stock-based compensation expense and increased building rent expense charged to the unallocated portion of G&A, as referenced above.
|
| | | | | | | | | | | | | | | | | | | |
Restructuring | Fiscal Year Ended March 31, | | Increase (Decrease) |
(in thousands) | 2013 | | 2012 | | 2011 | | 2013 vs. 2012 | | 2012 vs. 2011 |
Westell | $ | 149 |
| | $ | 275 |
| | $ | — |
| | $ | (126 | ) | | $ | 275 |
|
CNS | — |
| | 275 |
| | — |
| | (275 | ) | | 275 |
|
Consolidated restructuring expense | $ | 149 |
| | $ | 550 |
| | $ | — |
| | $ | (401 | ) | | $ | 550 |
|
In fiscal years 2013 and 2012, the Company’s Westell business segment recorded a restructuring charge of $0.1 million and $0.3 million, respectively, related to the relocation of Noran Tel production from Canada to the Company’s headquarters in Aurora, IL, primarily for employee termination benefits. Additionally, in fiscal year 2012, the CNS segment has a restructuring charge of $0.3 million for a reduction in force resulting from the CNS asset sale in April 2011. There were no restructuring expenses in fiscal year 2011.
|
| | | | | | | | | | | | | | | | | | | |
Intangible amortization | Fiscal Year Ended March 31, | | Increase (Decrease) |
(in thousands) | 2013 | | 2012 | | 2011 | | 2013 vs. 2012 | | 2012 vs. 2011 |
Westell | $ | 887 |
| | $ | 544 |
| | $ | 540 |
| | $ | 343 |
| | $ | 4 |
|
CNS | 5 |
| | 4 |
| | 5 |
| | 1 |
| | (1 | ) |
Consolidated intangible amortization | $ | 892 |
| | $ | 548 |
| | $ | 545 |
| | $ | 344 |
| | $ | 3 |
|
The intangibles assets consist of product technology and customer relationships derived from acquisitions. The increase in intangible amortization in fiscal year 2013, compared to fiscal year 2012, resulted from the ANTONE acquisition.
Goodwill impairment The Company recognized goodwill impairment of $2.9 million in fiscal year 2013. The goodwill impairment was the result of the Company's annual impairment testing which was significantly influenced by continuing operating losses and challenges in forecasting demand for the Company's products. The goodwill related to the Westell reporting unit and included $0.8 million relating to the 2007 acquisition of Noran Tel and $2.1 million relating to the fiscal 2013 acquisition of ANTONE.
Gain on CNS asset sale During the fiscal year 2012, the Company recorded a pre-tax gain of $31.7 million on the CNS asset sale.
Other income (expense) Other income (expense), net was $0.2 million, $0.3 million, and $20,000 for fiscal years 2013, 2012, and 2011, respectively. Other income (expense), net contains interest income earned on short-term investments and foreign currency gains and losses.
Income tax (expense) benefit Income tax in fiscal years 2013 and 2012 was expense of $29.4 million and $12.9 million, respectively, compared to an income tax benefit of $53.3 million in fiscal year 2011.
In fiscal year 2013, the Company considered both the positive and negative evidence available to assess the realizability of its deferred tax assets. The Company considered negative factors which included recent losses and a forecasted three-year cumulative loss position, as well as positive evidence consisting primarily of projected future earnings. The Company concluded that the negative evidence outweighed the objectively verifiable positive evidence. As a result, the Company increased the valuation allowance against deferred income tax assets by $34.0 million, which taken together with the liability for uncertain tax positions, has the effect of reserving in full all of the Company's deferred tax assets as of March 31, 2013.
In fiscal year 2012, the Company sold its ConferencePlus subsidiary and completed the CNS asset sale. These events resulted in a $64.5 million taxable gain in fiscal year 2012 and changed the outlook for future taxable income, positively with regards to the CNS business which contributed to the majority of the Company’s historical losses and negatively in certain states where income generated by ConferencePlus was apportioned. In addition, certain states for which the Company has net operating loss carryforwards, such as Illinois, suspended the use of those carryforwards. The Company therefore was not able to utilize those carryforwards to offset fiscal year 2012 taxable income. The Company considered both the positive and negative evidence and established a forecast of future taxable income to evaluate the deferred tax assets for realizability. On this basis, the Company concluded that it was more likely than not that it would be able to utilize the majority of its deferred tax assets, but that certain state net operating loss carryforwards would expire prior to utilization. As a result, the Company increased the valuation allowance reserve by $1.7 million to $(2.3) million in fiscal year 2012. In addition, the Company recognized $(2.1) million of net tax benefits relating to the change in uncertain tax positions.
In fiscal year 2011, after considering both the positive and negative evidence, including improved financial performance, expected future taxable income, the exit from a three-year cumulative loss, and the sale of the majority of its CNS business for a $31.7 million taxable gain, the Company concluded that it was more likely than not that it would be able to utilize the majority of its deferred tax assets. Prior to fiscal year 2011, a full valuation allowance on deferred tax assets was in place. As a result of the fiscal year 2011 assessment of realizability of deferred tax assets and current year income, the valuation allowance decreased by $60.8 million, which was recorded as an income tax benefit in fiscal year 2011. The Company also recognized an additional $0.7 million of tax benefits relating to changes in or expirations of uncertain tax positions.
Discontinued operations On December 31, 2011, the Company sold its ConferencePlus subsidiary for a gain of $20.5 million after income taxes. The results of operations of ConferencePlus along with the gain on the sale have been classified as income from discontinued operations. In fiscal year 2013, net loss from discontinued operations was $0.5 million. The loss resulted from a charge taken for a potential indemnification claim that related to the ConferencePlus sale transaction, partially offset by associated tax effects and unrelated discrete tax items. Net income from discontinued operations was $22.6 million and $4.8 million in fiscal years 2012 and 2011, respectively.
Net income (loss) In fiscal year 2013, the Company incurred a net loss of $44.0 million. Net income was $42.0 million and $67.9 million in fiscal years 2012 and 2011, respectively. The changes were due to the cumulative effects of the variances identified above.
Quarterly Results of Operations
The Company has experienced, and may continue to experience, fluctuations in quarterly results of operations. Such fluctuations in quarterly results may correspond to substantial fluctuations in the market price of the Class A Common Stock. Some factors which have had an influence on and may continue to influence the Company’s results of operations in a particular quarter include, but are not limited to, the size and timing of customer orders and subsequent shipments, customer order deferrals in anticipation of new products, timing of product introductions or enhancements by the Company or its competitors, market acceptance of new products, technological changes in the telecommunications industry, competitive pricing pressures, accuracy of customer forecasts of end-user demand, write-offs for excess or obsolete inventory, changes in the Company’s operating expenses, personnel changes, foreign currency fluctuations, changes in the mix of products sold, quality control of products sold, disruption in sources of supply, regulatory changes, capital spending, delays of payments by customers, working capital deficits and general economic conditions.
Sales to the Company’s customers typically involve long approval and procurement cycles and can involve large purchase commitments. Accordingly, cancellation or deferral of orders could cause significant fluctuations in the Company’s quarterly results of operations. As a result, the Company believes that period-to-period comparisons of its results of operations are not
necessarily meaningful and caution should be used when placing reliance upon such comparisons as indications of future performance.
For a detailed comparison of the eight quarters ended March 31, 2013, see Note 14, Quarterly Results of Operations (Unaudited), in the Notes to the consolidated financial statements.
Liquidity and Capital Resources
Overview
At March 31, 2013, the Company had $88.2 million in cash and cash equivalents and $24.3 million in short-term investments, consisting of bank deposits, money market funds, certificates of deposit and pre-refunded municipal bonds.
The Company does not have any significant debt nor does it have material capital expenditure requirements, balloon payments or other payments due on long term obligations. Off-balance sheet arrangements of the Company include the Enginuity note described in Note 9 of the Consolidated Financial Statements and standard operating leases. Total future obligations and commitments as of March 31, 2013, were $16.6 million. The Company believes that the existing sources of liquidity and cash from operations will satisfy cash flow requirements for the foreseeable future.
The Company did not seek renewal on its $12.0 million asset-based revolving credit facility that expired on March 31, 2013, because the facility had never been used and it was determined that other sources of liquidity are expected to be sufficient to meet liquidity needs.
On April 1, 2013, the Company used $30.0 million to acquire Kentrox, subject to an adjustment for working capital. On May 15, 2012, the Company acquired certain assets and liabilities of ANTONE for $2.5 million cash, subject to an adjustment for working capital, plus contingent cash consideration of up to an additional $3.5 million. The contingent consideration is based upon profitability of the acquired products for post-closing periods through June 30, 2016, and may be offset by working capital adjustments and indemnification claims. The contingent consideration is paid quarterly through June 30, 2016.
Cash Flows
The Consolidated Statements of Cash Flows include the ConferencePlus discontinued operations and therefore the explanations below include cash flows of ConferencePlus.
The Company’s operating activities used cash of $12.1 million and $5.0 million in fiscal years 2013 and 2012, respectively, and generated cash of $24.2 million in fiscal year 2011. Cash used in fiscal year 2013 resulted primarily from a $44.0 million net loss that includes $2.8 million of depreciation, amortization and stock-based compensation expense, a $29.9 million decrease in deferred tax assets and a $3.8 million decrease in working capital. Cash used in fiscal year 2012 resulted primarily from net income of $42.0 million that includes $3.3 million of depreciation, amortization and stock-based compensation expense, a $12.4 million decrease in deferred tax assets and an $11.4 million decrease in working capital. The changes in working capital in fiscal year 2012 resulted predominantly from the sale of the CNS business combined with the wind-down of that business. Cash generated in fiscal year 2011 resulted primarily from net income of $67.9 million that includes $3.7 million of depreciation, amortization and stock-based compensation expense, a $54.2 million increase in deferred tax assets and a $6.8 million increase in working capital.
The Company’s investing activities used $7.8 million and $1.3 million in fiscal years 2013 and 2011, respectively and generated $55.2 million in fiscal year 2012. In fiscal year 2013, the Company had net purchases of investments of $9.9 million, used $2.5 million for the ANTONE acquisition, and released $5.0 million of restricted stock. In fiscal year 2012, the Company generated $69.6 million from the CNS asset sale and the ConferencePlus business exclusive of cash held in escrow. In addition, the Company used $14.0 million in cash to purchase short-term investments and $0.8 million to make capital expenditures. Approximately half of the capital expenditures was in the Westell segment and half was in the discontinued ConferencePlus segment. In fiscal year 2011, the Company used $0.8 million on capital expenditures, primarily in its discontinued ConferencePlus segment, and $0.5 million in purchases of short-term investments.
The Company’s financing activities used cash of $12.6 million and $15.7 million in fiscal years 2013 and 2012, respectively, and provided cash of $2.0 million in fiscal year 2011. The Company purchased $12.7 million, $17.4 million, and $0.6 million of its outstanding stock, which is recorded as treasury stock, and received proceeds from the exercise of stock options of $0.1 million, $1.7 million, and $2.6 million in fiscal years 2013, 2012 and 2011, respectively.
Purchase obligations consist of inventory that arises in the normal course of business operations. Future obligations and commitments as of March 31, 2013 consisted of the following:
|
| | | | | | | | | | | | | | | | | | | | | | | | | | | |
| Payments due by fiscal year |
(in thousands) | 2014 | | 2015 | | 2016 | | 2017 | | 2018 | | Thereafter | | Total |
Purchase obligations | $ | 6,542 |
| | $ | — |
| | $ | — |
| | $ | — |
| | $ | — |
| | $ | — |
| | $ | 6,542 |
|
Future minimum lease payments for operating leases | 2,608 |
| | 2,111 |
| | 2,131 |
| | 2,152 |
| | 1,076 |
| | — |
| | 10,078 |
|
Future obligations and commitments | $ | 9,150 |
| | $ | 2,111 |
| | $ | 2,131 |
| | $ | 2,152 |
| | $ | 1,076 |
| | $ | — |
| | $ | 16,620 |
|
As of March 31, 2013, the Company had deferred tax assets of approximately $38.7 million before a valuation allowance of $36.3 million, resulting in a net deferred tax asset of $2.4 million. Also, as of March 31, 2013, the Company had a $2.8 million tax contingency reserve related to uncertain tax positions. Federal net operating loss carryforwards begin to expire in fiscal year 2023. Realization of deferred tax assets associated with the Company’s future deductible temporary differences, net operating loss carryforwards and tax credit carryforwards is dependent upon generating sufficient taxable income prior to their expiration, among other factors. The Company weighed positive and negative evidence to assess the need for a valuation allowance against deferred tax assets and whether a tax benefit should be recorded when taxable losses are incurred. The existence of a valuation allowance does not limit the availability of tax assets to reduce taxes payable when taxable income arises. Management periodically evaluates the recoverability of the deferred tax assets and may adjust the valuation allowance against deferred tax assets accordingly.
Off-Balance Sheet Arrangements
In fiscal year 2005, the Company sold its Data Station Termination product lines and specified fixed assets to Enginuity Communications Corporation (“Enginuity”). The Company provided an unconditional guarantee relating to a 10-year term note payable by Enginuity to a third-party lender that financed the transaction (the “Enginuity Note”). The Enginuity Note had an unpaid balance of $0.3 million as of March 31, 2013. Certain owners of Enginuity personally guaranteed the note and pledged assets as collateral. These personal guarantees will stay in place until the note is paid in full, as will the Company’s. Under the Company’s guarantee, the Company must pay all amounts due under the note payable upon demand from the lender; however, the Company would have recourse against the assets of Enginuity, the personal guarantees, and pledged assets.
The Company evaluated ASC 810 and concluded that Enginuity is a VIE as a result of the debt guarantee. The Company is not considered the primary beneficiary of the VIE and consolidation therefore is not required. At the time of the product sale, the Company assessed its obligation under this guarantee pursuant to the provisions of ASC topic 460: Guarantees (“ASC 460”), and recorded a $0.3 million liability for the value of the guarantee. The Company evaluates the fair value of the liability based on Enginuity’s operating performance and the current status of the guaranteed debt obligation and determined no liability is needed as of March 31, 2013.
ITEM 7A. QUANTITATIVE AND QUALITATIVE DISCLOSURES ABOUT MARKET RISK
The Company is subject to certain market risks, including foreign currency rate exposures and interest rates.
Foreign Currency Risk
The Company’s primary foreign currency exposure is to changes in exchange rates for the U.S. dollar versus the Canadian dollar and the related effects on receivables and payables denominated in Canadian dollars. The Company’s foreign subsidiary, Noran Tel, is located in Canada. In the quarter ended September 30, 2012, the Company completed the relocation of the production of products from Canada to its headquarters in Aurora, IL. Noran Tel has five remaining employees located in Canada and is now focused on the development of power distribution products and the sale of Westell products in Canada. Noran Tel is funded by the U.S. operations. On August 1, 2012, the functional currency for Noran Tel was changed from the Canadian dollar to the U.S. dollar. The Company will continue to have revenue and expenses denominated in Canadian currency, but it is no longer exposed to gains and losses from fluctuations affecting net investments and earnings of Noran Tel. The Canadian entity revenues, which are denominated in U.S. dollars, are solely from its parent, Westell Inc., located in the U.S. Approximately 3.8% of the Company’s fiscal year 2013 revenue was denominated in foreign currencies.
As of March 31, 2013, the balance in the cumulative foreign currency translation adjustment account, which is a component of stockholders’ equity, was an unrealized gain of $0.6 million.
The Company has determined that a change in exchange rates for the U.S. dollar versus the Canadian dollar would have in immaterial impact on the Company's financial results at March 31, 2013. Although the Company’s supply contracts are
denominated in U.S. dollars, changes in foreign currency rates, particularly for Asian currencies, may have indirect impacts on the Company’s costs.
Interest Rate and Default Risk
The Company has an investment portfolio consisting of bank deposits, money market funds, certificates of deposit and pre-refunded municipal bonds. These securities, like all fixed income instruments, may be subject to interest rate risk and default risk, and they will fall in value if market interest rates increase or if risks of default rise. Due to the short duration and conservative, high-quality nature of our investment portfolio, a movement of 10% by market interest rates would not have a material impact on our operating results and the total value of the portfolio.
ITEM 8. FINANCIAL STATEMENTS AND SUPPLEMENTARY DATA
The Company’s Consolidated Financial Statements required by Item 8, together with the reports thereon of the Independent Registered Public Accounting Firm are set forth on pages 35—66 of this report and are incorporated by reference in this Item 8. The Consolidated Financial Statement schedule listed under Item 15(a)2, is set forth on page 67 of this report and is incorporated by referenced in this Item 8 and should be read in conjunction with the financial statements.
ITEM 9. CHANGES IN AND DISAGREEMENTS WITH ACCOUNTANTS ON ACCOUNTING AND FINANCIAL DISCLOSURE
None.
|
| |
ITEM 9A. | CONTROLS AND PROCEDURES |
Evaluation of Disclosure Controls and Procedures
Under the supervision and with the participation of the Company’s senior management, including the Company’s Chief Executive Officer and Chief Financial Officer, the Company conducted an evaluation of the effectiveness of the design and operation of the Company’s disclosure controls and procedures, as defined in Rules 13a-15(e) and 15d-15(e) under the Securities Exchange Act of 1934, as amended (the “Exchange Act”), as of the end of the period covered by this annual report (the “Evaluation Date”). Based upon this evaluation, the Company’s Chief Executive Officer and Chief Financial Officer concluded as of the Evaluation Date that the Company’s disclosure controls and procedures were effective such that the information relating to the Company, including consolidated subsidiaries, required to be disclosed in the Company’s Securities and Exchange Commission (“SEC”) reports (i) is recorded, processed, summarized and reported within the time periods specified in SEC rules and forms, and (ii) is accumulated and communicated to the Company’s management, including the Company’s Chief Executive Officer and Chief Financial Officer, as appropriate to allow timely decisions regarding required disclosure.
Management’s Report on Internal Control Over Financial Reporting
Management is responsible for establishing and maintaining adequate internal control over financial reporting, as such term is defined in Exchange Act Rules 13a-15(f) and 15d-15(f). There are inherent limitations to the effectiveness of any system of internal control over financial reporting, including the possibility of human error and the circumvention or overriding of the controls and procedures. Accordingly, even an effective system of internal control over financial reporting can provide only reasonable assurance with respect to financial statement preparation and presentation in accordance with generally accepted accounting principles. Also, projections of any evaluation of effectiveness to future periods are subject to risk that controls may become inadequate because of changes in conditions, or that the degree of compliance with the policies or procedures may deteriorate.
Management, with participation of the Company’s Chief Executive Officer and Chief Financial Officer, assessed the effectiveness of the Company’s internal control over financial reporting as of March 31, 2013, based on criteria established in Internal Control-Integrated Framework issued by the Committee of Sponsoring Organizations of the Treadway Commission (“COSO”) and concluded that the Company’s internal control over financial reporting was effective as of March 31, 2013.
The Company’s Independent Registered Public Accounting Firm has issued an audit opinion on its assessment of the Company’s internal control over financial reporting as of March 31, 2013. This report is included on page 36.
Changes in Internal Control Over Financial Reporting
There have been no changes in the Company’s internal control over financial reporting that occurred during the three months ended March 31, 2013, that have materially affected or are reasonably likely to materially affect the Company’s internal control over financial reporting.
The Company acquired ANTONE on May 15, 2012, and during the time between the acquisition and the fourth quarter the Company implemented specific transitional controls for the acquired business. The Company completed integration of ANTONE into the existing system of internal controls over financial reporting during the fourth quarter of 2013.
|
| |
ITEM 9B. | OTHER INFORMATION |
None.
PART III
|
| |
ITEM 10. | DIRECTORS, EXECUTIVE OFFICERS AND CORPORATE GOVERNANCE |
(a) Directors of the Company
The information required by this Item is set forth in the Company’s Proxy Statement for the Annual Meeting of Stockholders to be held in September 2013 under the captions “Election of Directors,” “Corporate Governance – Board Committees,” and “Section 16(a). Beneficial Ownership Reporting Compliance,” which information is incorporated herein by reference.
(b) Executive Officers of the Company
The information required by this Item is set forth in the Company’s Proxy Statement for the Annual Meeting of Stockholders to be held in September 2013 under the caption “Corporate Governance—Executive Officers,” which information is incorporated herein by reference.
Code of Business Conduct
We have adopted a Code of Business Conduct within the meaning of Item 406(b) of Regulation S-K. This Code of Business Conduct applies to all of our directors, officers (including the principal executive officer, principal financial officer, principal accounting officer and any person performing similar functions) and employees. This Code of Business Conduct is publicly available in the corporate governance section on our website at http://www.westell.com. The Company intends to satisfy the disclosure requirement under Item 5.05 of Form 8-K by posting on its website any amendments to, or waivers from, its Code of Business Conduct applicable to our principal executive officer, principal financial officer, principal accounting officer and any person performing similar functions. Copies of the Code of Business Conduct will be provided free of charge upon written request directed to the Secretary of the Company at the address of the principal executive offices.
|
| |
ITEM 11. | EXECUTIVE COMPENSATION |
The information required by this Item is set forth in the Company’s Proxy Statement for the Annual Meeting of Stockholders to be held in September 2013 under the captions “Compensation Discussion and Analysis,” “Compensation Committee Interlocks and Insider Participation,” “Compensation Committee Report on Executive Compensation,” “Summary Compensation Table,” “Grants of Plan-Based Awards,” “Outstanding Equity Awards at Fiscal Year-End,” “Option Exercises and Stock Vested,” “Potential Payments Upon Termination or Change in Control,” and “Director Compensation,” which information is incorporated herein by reference.
|
| |
ITEM 12. | SECURITY OWNERSHIP OF CERTAIN BENEFICIAL OWNERS AND MANAGEMENT AND RELATED STOCKHOLDER MATTERS |
The information required by this Item is set forth in the Company’s Proxy Statement for the Annual Meeting of Stockholders to be held in September 2013 under the captions “Ownership of the Capital Stock of the Company,” and “Equity Compensation Plan Information,” which information is incorporated herein by reference.
|
| |
ITEM 13. | CERTAIN RELATIONSHIPS AND RELATED TRANSACTIONS, AND DIRECTOR INDEPENDENCE |
The information required by this Item is set forth in the Company’s Proxy Statement for the Annual Meeting of Stockholders to be held in September 2013 under the caption “Certain Relationships and Related Party Transactions,” and “Corporate Governance – Director Independence,” which information is incorporated herein by reference.
|
| |
ITEM 14. | PRINCIPAL ACCOUNTANT FEES AND SERVICES |
The information required by this item is incorporated herein by reference to the sections entitled “Fees to the Company’s Auditors” and “Approval of Services Provided by Independent Registered Public Accounting Firm” in the Company’s Proxy Statement for the Annual Meeting of Stockholders to be held in September 2013.
PART IV
|
| |
ITEM 15. | EXHIBITS AND FINANCIAL STATEMENT SCHEDULE |
(a)(1) Financial Statements
The following documents are filed as part of this report:
The Consolidated Financial Statements of Westell Technologies, Inc. at March 31, 2013, and 2012, and for each of the three fiscal years in the period ended March 31, 2013, together with the Report of Independent Registered Public Accounting Firm, are set forth on 35 through 66 of this Report.
The supplemental financial information listed and appearing hereafter should be read in conjunction with the Consolidated Financial Statements included in the report.
(2) Financial Statement Schedule
The following are included in Part IV of this Report for each of the years ended March 31, 2013, 2012, and 2011, as applicable:
Schedule II - Valuation and Qualifying Accounts - page 67
Financial statement schedules not included in this report have been omitted either because they are not applicable or because the required information is shown in the Consolidated Financial Statements or notes thereto, included in this report.
(3) Exhibits
|
| | |
| | |
Exhibit Number | | Document Description |
| |
2.1 | | Asset Purchase Agreement dated as of March 17, 2011, by and between Westell Technologies, Inc., Westell, Inc., NETGEAR, Inc., and NETGEAR Ltd. (incorporated herein by reference to Exhibit 2.1 to the Company's Form 8-K filed on March 18, 2011). |
| | |
2.2 | | Stock Purchase Agreement, dated December 20, 2011, among Arkadin S.A.S, Arkadin, Inc. and Westell Technologies, Inc. (incorporated herein by reference to Exhibit 2.1 to the Company’s Current Report on Form 8-K filed on December 21, 2011). |
| | |
2.3 | | Agreement and Plan of Merger, dated as of March 15, 2013, by and among Westell, Inc., Wes Acquisition Sub, Inc., Kentrox, Inc., and Investcorp Technology Ventures II, L.P. (incorporated by reference to Exhibit 2.1 to the Westell Technologies, Inc. Form 8-K filed on March 18, 2013). |
| | |
3.1 | | Amended and Restated Certificate of Incorporation, as amended (incorporated herein by reference to Exhibit 3.1 to the Company’s Quarterly Report on Form 10-Q for the quarter ended June 30, 2005). |
| |
3.2 | | Amended and Restated By-laws (incorporated herein by reference to Exhibit 3.1 to the Company's Form 8-K filed on December 18, 2009). |
| |
9.1 | | Voting Trust Agreement dated February 23, 1994, as amended (incorporated herein by reference to Exhibit 9.1 to the Company’s Registration Statement on Form S-1, as amended, Registration No. 33-98024). |
| |
10.1(a) | | Credit Agreement, dated as of March 5, 2009, among Westell Technologies, Inc., Westell, Inc., Teltrend LLC and Conference Plus, Inc., as borrowers, and The PrivateBank and Trust Company, as lender (incorporated herein by reference to Exhibit 10.37 to the Company’s Annual Report on Form 10-K for the year ended March 31, 2009). |
| | |
10.1(b) | | First Amendment, dated as of March 5, 2010, to Credit Agreement dated as of March 5, 2009, by and among Westell Technologies, Inc., Westell, Inc., Teltrend LLC, Conference Plus, Inc. and The PrivateBank and Trust Company (incorporated herein by reference to Exhibit 10.1 to the Company’s Form 8-K filed on March 8, 2010). |
| | |
10.1(c) | | Second Amendment, dated as of March 31, 2011, to Credit Agreement dated as of March 5, 2009, by and among Westell Technologies, Inc., Westell, Inc., Teltrend LLC, Conference Plus, Inc. and The PrivateBank and Trust Company (incorporated herein by reference to Exhibit 10.1 to the Company’s Form 8-K filed on April 5, 2011). |
| | |
10.1(d) | | Third Amendment, dated as of June 17, 2011, to Credit Agreement dated as of March 5, 2009, by and among Westell Technologies, Inc., Westell, Inc., Teltrend LLC, Conference Plus, Inc. and The PrivateBank and Trust Company (incorporated herein by reference to Exhibit 10.1 to the Company’s Form 10-Q filed on July 29, 2011). |
| | |
10.1(e) | | Fourth Amendment, dated as of March 26, 2012, to Credit Agreement dated as of March 5, 2009, by and among Westell Technologies, Inc., Westell, Inc., Teltrend LLC, and The PrivateBank and Trust Company (incorporated herein by reference to Exhibit 10.1 to the Company’s Form 8-K filed on March 26, 2012). |
| | |
10.1(f) | | Guaranty and Security Agreement, dated as of March 5, 2009, among Westell Technologies, Inc., Westell, Inc., Teltrend LLC, Conference Plus, Inc. and the other parties thereto, as guarantors and grantors, in favor of The PrivateBank and Trust Company (incorporated herein by reference to Exhibit 10.38 to the Company’s Annual Report on Form 10-K for the year ended March 31, 2009). |
| | |
10.2 | | Stock Transfer Restriction Agreement entered into by members of the Penny family, as amended (incorporated herein by reference to Exhibits 10.4 and 10.16 to the Company’s Registration Statement on Form S-1, as amended, Registration No. 33-98024). |
| | |
10.3 | | Form of Registration Rights Agreement among Westell Technologies, Inc. and trustees of the Voting Trust dated February 23, 1994 (incorporated herein by reference to Exhibit 10.5 to the Company’s Registration Statement on Form S-1, as amended, Registration No. 33-98024). |
| | |
*10.4 | | 1995 Stock Incentive Plan (incorporated herein by reference to Exhibit 10.6 to the Company’s Registration Statement on Form S-1, as amended, Registration No. 33-98024). |
|
| | |
*10.5 | | Employee Stock Purchase Plan (as amended) (incorporated herein by reference to the exhibit filed with the Company’s Proxy Statement for the 2008 Annual Meeting of Stockholders filed on July 29, 2008). |
| |
10.6 | | Lease dated September 29, 1997, between WTI (IL) QRS 12-36, Inc., and Westell, Inc. (incorporated herein by reference to Exhibit 99.3 to the Company’s Form 8-K filed on October 2, 1997). |
| |
10.7 | | Settlement Agreement dated November 30, 2002, with respect to the lease dated September 29, 1997 (incorporated herein by reference to Exhibit 10.12 to the Company’s Annual Report on Form 10-K for the year ended March 31, 2008). |
| |
*10.8 | | Form of Indemnification Agreement for Directors and Officers of the Company (incorporated herein by reference to Exhibit 10.1 to the Company’s Quarterly Report on Form 10-Q for the quarter ended September 30, 2010). |
| |
*10.9 | | Westell Technologies, Inc. 2004 Stock Incentive Plan, as amended and restated as of June 29, 2010 (incorporated herein by reference to Annex A to the Company’s Proxy Statement for the 2010 Annual Meeting of Stockholders filed on July 29, 2010). |
| |
*10.10(a) | | Form of Restricted Stock Unit Award for awards granted on or prior to April 4, 2011, under the Westell Technologies, Inc. 2004 Stock Incentive Plan (incorporated herein by reference to Exhibit 10.10 to the Company’s Annual Report on Form 10-K for the year ended March 31, 2010). |
| |
*10.10(b) | | Form of Restricted Stock Unit Award Agreement for awards granted to Richard S. Gilbert and Brian S. Cooper on April 4, 2011 under the Westell Technologies, Inc. 2004 Stock Incentive Plan (incorporated herein by reference to Exhibit 10.1 to the Company’s Form 8-K filed on April 6, 2011). |
| |
*10.10(c) | | Form of Restricted Stock Unit Award Agreement for awards granted subsequent to April 4, 2011, under the Westell Technologies, Inc. 2004 Stock Incentive Plan (incorporated by reference to Exhibit 10.10(c) to the Company's Annual Report on Form 10-K for the year ended March 31, 2012). |
| |
*10.11 | | Form of Stock Option Award under the Westell Technologies, Inc. 2004 Stock Incentive Plan (incorporated herein by reference to Exhibit 10.4 to the Company’s Quarterly Report on Form 10-Q for the quarter ended December 31, 2008). |
| |
*10.12 | | General Waiver and Release Agreement, dated December 31, 2011, by and between Westell Technologies, Inc. and Timothy J. Reedy (incorporated herein by reference to Exhibit 10.1 to the Company’s Current Report on Form 8-K filed on January 6, 2012). |
| |
*10.13 | | Settlement Agreement and Release dated December 31, 2011, by and between Westell Technologies, Inc. and Timothy J. Reedy (incorporated herein by reference to Exhibit 10.1 to the Company’s Current Report on Form 8-K filed on January 6, 2012). |
| |
*10.14 | | Form of Incentive Stock Option Award under the 2004 Stock Incentive Plan (incorporated herein by reference to Exhibit 10.22 to the Company’s Annual Report on Form 10-K for the year ended March 31, 2010). |
| | |
*10.15 | | Employment Agreement, dated January 18, 2011, by and among Westell Technologies, Inc., Westell, Inc. and Richard S. Gilbert (incorporated herein by reference to Exhibit 10.1 to the Company’s Form 8-K filed on January 19, 2011). |
| |
*10.16 | | Employment Agreement, dated January 18, 2011, by and between Westell Technologies, Inc., Westell, Inc. and Brian S. Cooper (incorporated herein by reference to Exhibit 10.2 to the Company’s Form 8-K filed on January 19, 2011). |
| |
*10.17 | | Westell Technologies, Inc. Incentive Compensation Plan (incorporated herein by reference to Annex B to the Company’s Proxy Statement for the 2010 Annual Meeting of Stockholders filed on July 29, 2010). |
| |
*10.18 | | Summary of Director Compensation (incorporated by reference to Exhibit 10.18 to the Company's Annual Report on Form 10-K for the year ended March 31, 2012). |
| |
*10.19 | | Form of Non-Employee Director Restricted Stock Award under the 2004 Stock Incentive Plan for awards granted prior to April 2010 (incorporated herein by reference to Exhibit 10.20 to the Company’s Annual Report on Form 10-K for the year ended March 31, 2010). |
| |
*10.20 | | Form of Non-Employee Director Restricted Stock Award under the 2004 Stock Incentive Plan for awards granted on or after April 1, 2010 (incorporated herein by reference to Exhibit 10.21 to the Company’s Annual Report on Form 10-K for the year ended March 31, 2010). |
| |
|
| | |
21.1 | | Subsidiaries of the Registrant. |
| |
23.1 | | Consent of Ernst & Young LLP. |
| |
31.1 | | Certification of the Chief Executive Officer pursuant to Section 302 of Sarbanes-Oxley Act of 2002. |
| |
31.2 | | Certification of the Chief Financial Officer pursuant to Section 302 of Sarbanes-Oxley Act of 2002. |
| |
32.1 | | Certification of the Chief Executive Officer and Chief Financial Officer pursuant to Section 906 of Sarbanes-Oxley Act of 2002. |
| |
101 | | The following financial information from the Annual Report on Form 10-K for the year ended March 31, 2013, formatted in XBRL (eXtensible Business Reporting Language): (i) the Consolidated Balance Sheets; (ii) the Consolidated Statements of Operations; (iii) the Consolidated Statements of Comprehensive Income (Loss); (iv) the Consolidated Statements of Stockholders’ Equity; (v) the Consolidated Statements of Cash Flows; and (vi) the Notes to the Consolidated Financial Statements. |
|
| |
* | Management contract or compensatory plan or arrangement. |
(b) Exhibits
The exhibits filed as part of this Annual Report on Form 10-K are as specified in Item 15(a)(3) herein.
(c) Financial Statement Schedule
The financial statement schedule filed as part of this Annual Report on Form 10-K is as specified in Item 15(a)(2) herein.
SIGNATURES
Pursuant to the requirements of Section 13 or 15(d) of the Securities Exchange Act of 1934, the registrant has duly caused this report to be signed on its behalf by the undersigned, thereunto duly authorized on May 24, 2013.
|
| | |
| | |
WESTELL TECHNOLOGIES, INC. |
| |
By | | /s/ Richard S. Gilbert |
| | Richard S. Gilbert |
| | President and Chief Executive Officer |
Pursuant to the requirements of the Securities Exchange Act of 1934, this report has been signed below by the following persons on behalf of the registrant and in the capacities indicated on May 24, 2013.
|
| | |
| | |
Signature | | Title |
| |
/s/ Richard S. Gilbert | | President, Chief Executive Officer and Chairman of the Board (Principal Executive Officer) |
Richard S. Gilbert | |
| |
/s/ Brian S. Cooper | | Chief Financial Officer, Treasurer and Secretary (Principal Financial Officer) |
Brian S. Cooper | |
| |
/s/ Amy T. Forster | | Vice President and Corporate Controller (Principal Accounting Officer) |
Amy T. Forster | |
| |
/s/ Kirk R. Brannock | | Director |
Kirk R. Brannock | |
| |
/s/ Robert W. Foskett | | Director |
Robert W. Foskett | |
| |
/s/ James M. Froisland | | Director |
James M. Froisland | |
| |
/s/ Dennis O. Harris | | Director |
Dennis O. Harris | |
| |
/s/ Martin Hernandez | | Director |
Martin Hernandez | |
| |
/s/ Eileen A. Kamerick | | Director |
Eileen A. Kamerick | |
| |
/s/ Robert C. Penny III | | Director |
Robert C. Penny III | |
INDEX TO CONSOLIDATED FINANCIAL STATEMENTS
AND SUPPLEMENTARY DATA
|
| |
| Page |
Item | |
| |
| |
| |
| |
| |
| |
| |
| |
| |
| |
Financial Statement Schedule: | |
| |
| |
Report of Independent Registered Public Accounting Firm
The Board of Directors and Stockholders of
Westell Technologies, Inc. and Subsidiaries
We have audited the accompanying consolidated balance sheets of Westell Technologies, Inc. and Subsidiaries (the Company) as of March 31, 2013 and 2012, and the related consolidated statements of operations, comprehensive income (loss), stockholders' equity, and cash flows for each of the three years in the period ended March 31, 2013. Our audits also included the financial statement schedule listed in the Index at Item 15(a)(2). These financial statements and schedule are the responsibility of the Company's management. Our responsibility is to express an opinion on these financial statements and schedule based on our audits.
We conducted our audits in accordance with the standards of the Public Company Accounting Oversight Board (United States). Those standards require that we plan and perform the audit to obtain reasonable assurance about whether the financial statements are free of material misstatement. An audit includes examining, on a test basis, evidence supporting the amounts and disclosures in the financial statements. An audit also includes assessing the accounting principles used and significant estimates made by management, as well as evaluating the overall financial statement presentation. We believe that our audits provide a reasonable basis for our opinion.
In our opinion, the financial statements referred to above present fairly, in all material respects, the consolidated financial position of Westell Technologies, Inc. and Subsidiaries at March 31, 2013 and 2012, and the consolidated results of its operations and its cash flows for each of the three years in the period ended March 31, 2013, in conformity with U.S. generally accepted accounting principles. Also, in our opinion, the related financial statement schedule, when considered in relation to the basic financial statements taken as a whole, presents fairly, in all material respects, the information set forth therein.
We also have audited, in accordance with the standards of the Public Company Accounting Oversight Board (United States), Westell Technologies, Inc. and Subsidiaries' internal control over financial reporting as of March 31, 2013, based on criteria established in Internal Control - Integrated Framework issued by the Committee of Sponsoring Organizations of the Treadway Commission, and our report dated May 24, 2013, expressed an unqualified opinion thereon.
/s/ Ernst & Young LLP
Chicago, Illinois
May 24, 2013
Report of Independent Registered Public Accounting Firm on Internal Control Over Financial Reporting
The Board of Directors and Stockholders of
Westell Technologies, Inc. and Subsidiaries
We have audited Westell Technologies, Inc. and Subsidiaries' internal control over financial reporting as of March 31, 2013, based on criteria established in Internal Control - Integrated Framework issued by the Committee of Sponsoring Organizations of the Treadway Commission (the COSO criteria). Westell Technologies, Inc. and Subsidiaries' management is responsible for maintaining effective internal control over financial reporting and for its assessment of the effectiveness of internal control over financial reporting included in the accompanying Management's Annual Report on Internal Control over Financial Reporting. Our responsibility is to express an opinion on the company's internal control over financial reporting based on our audit.
We conducted our audit in accordance with the standards of the Public Company Accounting Oversight Board (United States). Those standards require that we plan and perform the audit to obtain reasonable assurance about whether effective internal control over financial reporting was maintained in all material respects. Our audit included obtaining an understanding of internal control over financial reporting, assessing the risk that a material weakness exists, testing and evaluating the design and operating effectiveness of internal control based on the assessed risk, and performing such other procedures as we considered necessary in the circumstances. We believe that our audit provides a reasonable basis for our opinion.
A company's internal control over financial reporting is a process designed to provide reasonable assurance regarding the reliability of financial reporting and the preparation of financial statements for external purposes in accordance with generally accepted accounting principles. A company's internal control over financial reporting includes those policies and procedures that (1) pertain to the maintenance of records that, in reasonable detail, accurately and fairly reflect the transactions and dispositions of the assets of the company; (2) provide reasonable assurance that transactions are recorded as necessary to permit preparation of financial statements in accordance with generally accepted accounting principles, and that receipts and expenditures of the company are being made only in accordance with authorizations of management and directors of the company; and (3) provide reasonable assurance regarding prevention or timely detection of unauthorized acquisition, use, or disposition of the company's assets that could have a material effect on the financial statements.
Because of its inherent limitations, internal control over financial reporting may not prevent or detect misstatements. Also, projections of any evaluation of effectiveness to future periods are subject to the risk that controls may become inadequate because of changes in conditions, or that the degree of compliance with the policies or procedures may deteriorate.
In our opinion, Westell Technologies, Inc. and Subsidiaries maintained, in all material respects, effective internal control over financial reporting as of March 31, 2013, based on the COSO criteria.
We also have audited, in accordance with the standards of the Public Company Accounting Oversight Board (United States), the consolidated balance sheets of Westell Technologies, Inc. and Subsidiaries' as of March 31, 2013 and 2012, and the related consolidated statements of operations, comprehensive income (loss), stockholders' equity, and cash flows for each of the three years in the period ended March 31, 2013 of Westell Technologies, Inc. and Subsidiaries, and our report dated May 24, 2013, expressed an unqualified opinion thereon.
/s/ Ernst & Young LLP
Chicago, Illinois
May 24, 2013
WESTELL TECHNOLOGIES, INC. AND SUBSIDIARIES
CONSOLIDATED BALANCE SHEETS
(In thousands, except share amounts)
|
| | | | | | | |
| March 31, 2013 | | March 31, 2012 |
Assets | | | |
Current assets: | | | |
Cash and cash equivalents | $ | 88,233 |
| | $ | 120,832 |
|
Restricted cash | 2,500 |
| | 7,451 |
|
Short-term investments | 24,349 |
| | 14,455 |
|
Accounts receivable (net of allowance of $10 and $12 as of March 31, 2013 and 2012, respectively) | 6,689 |
| | 5,710 |
|
Inventories | 12,223 |
| | 9,906 |
|
Prepaid expenses and other current assets | 1,804 |
| | 1,456 |
|
Deferred income tax assets | — |
| | 1,859 |
|
Total current assets | 135,798 |
| | 161,669 |
|
Property and equipment: | | | |
Machinery and equipment | 1,162 |
| | 1,174 |
|
Office, computer and research equipment | 8,659 |
| | 8,837 |
|
Leasehold improvements | 7,515 |
| | 7,720 |
|
Total property and equipment, gross | 17,336 |
| | 17,731 |
|
Less accumulated depreciation and amortization | (16,255 | ) | | (16,534 | ) |
Property and equipment, net | 1,081 |
| | 1,197 |
|
Goodwill | — |
| | 801 |
|
Intangibles, net | 5,063 |
| | 2,728 |
|
Deferred income tax assets | 2,735 |
| | 30,740 |
|
Other assets | 495 |
| | 291 |
|
Total assets | $ | 145,172 |
| | $ | 197,426 |
|
Liabilities and Stockholders’ Equity | | | |
Current liabilities: | | | |
Accounts payable | $ | 4,126 |
| | $ | 3,142 |
|
Accrued expenses | 2,957 |
| | 2,125 |
|
Accrued compensation | 996 |
| | 1,203 |
|
Total current liabilities | 8,079 |
| | 6,470 |
|
Accrual for uncertain tax benefits | 2,768 |
| | 3,483 |
|
Contingent consideration payable | 2,333 |
| | — |
|
Other long-term liabilities | 915 |
| | 1,109 |
|
Total liabilities | 14,095 |
| | 11,062 |
|
Commitments and contingencies (Notes 1 and 5) |
|
| |
|
|
Stockholders’ equity: | | | |
Class A common stock, par $0.01, Authorized – 109,000,000 shares
Outstanding – 44,969,841 and 50,429,399 shares at March 31, 2013 and 2012, respectively | 450 |
| | 504 |
|
Class B common stock, par $0.01, Authorized – 25,000,000 shares
Issued and outstanding – 13,937,151 shares at both March 31, 2013 and 2012 | 139 |
| | 139 |
|
Preferred stock, par $0.01, Authorized – 1,000,000 shares
Issued and outstanding – none | — |
| | — |
|
Additional paid-in capital | 406,638 |
| | 405,147 |
|
Treasury stock at cost – 16,969,296 and 11,180,931 shares at March 31, 2013 and 2012, respectively | (33,848 | ) | | (21,173 | ) |
Cumulative translation adjustment | 608 |
| | 619 |
|
Accumulated deficit | (242,910 | ) | | (198,872 | ) |
Total stockholders’ equity | 131,077 |
| | 186,364 |
|
Total liabilities and stockholders’ equity | $ | 145,172 |
| | $ | 197,426 |
|
The accompanying notes are an integral part of these Consolidated Financial Statements.
WESTELL TECHNOLOGIES, INC. AND SUBSIDIARIES
CONSOLIDATED STATEMENTS OF OPERATIONS
(In thousands, except per share amounts)
|
| | | | | | | | | | | |
| Fiscal Year Ended March 31, |
| 2013 | | 2012 | | 2011 |
Revenue | $ | 40,044 |
| | $ | 69,655 |
| | $ | 147,849 |
|
Cost of goods sold | 25,720 |
| | 46,398 |
| | 106,297 |
|
Gross profit | 14,324 |
| | 23,257 |
| | 41,552 |
|
Operating expenses: | | | | | |
Sales and marketing | 7,439 |
| | 6,496 |
| | 10,813 |
|
Research and development | 7,326 |
| | 7,727 |
| | 11,774 |
|
General and administrative | 9,910 |
| | 7,615 |
| | 8,623 |
|
Intangible amortization | 892 |
| | 548 |
| | 545 |
|
Restructuring | 149 |
| | 550 |
| | — |
|
Goodwill impairment | 2,884 |
| | — |
| | — |
|
Total operating expenses | 28,600 |
| | 22,936 |
| | 31,755 |
|
Operating income (loss) | (14,276 | ) | | 321 |
| | 9,797 |
|
Gain on CNS asset sale | — |
| | 31,654 |
| | — |
|
Other income (expense), net | 175 |
| | 331 |
| | 20 |
|
Income (loss) before income taxes and discontinued operations | (14,101 | ) | | 32,306 |
| | 9,817 |
|
Income tax (expense) benefit | (29,392 | ) | | (12,875 | ) | | 53,304 |
|
Net income (loss) from continuing operations | (43,493 | ) | | 19,431 |
| | 63,121 |
|
Discontinued operations (Note 1): | | | | | |
Gain on sale of discontinued operations, net of tax expense of $12,359 | — |
| | 20,489 |
| | — |
|
Income (loss) from discontinued operations, net of tax benefit (expense) of $813, $(1,447) and $(53) for fiscal years 2013, 2012 and 2011, respectively | (545 | ) | | 2,062 |
| | 4,815 |
|
Net income (loss) | $ | (44,038 | ) | | $ | 41,982 |
| | $ | 67,936 |
|
Basic net income (loss) per share: | | | | | |
Basic net income (loss) from continuing operations | $ | (0.73 | ) | | $ | 0.29 |
| | $ | 0.93 |
|
Basic net income (loss) from discontinued operations | (0.01 | ) | | 0.34 |
| | 0.07 |
|
Basic net income (loss) per share * | $ | (0.73 | ) | | $ | 0.63 |
| | $ | 1.00 |
|
Diluted net income (loss) per share: | | | | | |
Diluted net income (loss) from continuing operations | $ | (0.73 | ) | | $ | 0.29 |
| | $ | 0.91 |
|
Diluted net income (loss) from discontinued operations | (0.01 | ) | | 0.33 |
| | 0.07 |
|
Diluted net income (loss) per share * | $ | (0.73 | ) | | $ | 0.62 |
| | $ | 0.98 |
|
Weighted-average number of shares outstanding: | | | | | |
Basic | 59,944 |
| | 66,657 |
| | 67,848 |
|
Effect of dilutive securities: restricted stock, restricted stock units, performance stock units and stock options** | — |
| | 1,322 |
| | 1,629 |
|
Diluted | 59,944 |
| | 67,979 |
| | 69,477 |
|
The accompanying notes are an integral part of these Consolidated Financial Statements.
*Per share amounts may not sum to totals because of rounding.
** In periods with a net loss, the basic loss per share equals the diluted loss per share as all common stock equivalents are excluded from the per share calculation. The Company had 1.2 million and 2.4 million options outstanding as of March 31, 2012 and 2011, respectively, which were not included in the computation of average diluted shares outstanding because they were anti-dilutive.
WESTELL TECHNOLOGIES, INC. AND SUBSIDIARIES
CONSOLIDATED STATEMENTS OF COMPREHENSIVE INCOME (LOSS)
(In thousands)
|
| | | | | | | | | | | |
| Fiscal Year Ended March 31, |
| 2013 | | 2012 | | 2011 |
Net income (loss) | $ | (44,038 | ) | | $ | 41,982 |
| | $ | 67,936 |
|
Other comprehensive income (loss): | | | | | |
Foreign currency translation adjustment | (11 | ) | | (346 | ) | | 320 |
|
Total other comprehensive income (loss) | (11 | ) | | (346 | ) | | 320 |
|
Total comprehensive income (loss) | $ | (44,049 | ) | | $ | 41,636 |
| | $ | 68,256 |
|
The accompanying notes are an integral part of these Consolidated Financial Statements.
WESTELL TECHNOLOGIES, INC. AND SUBSIDIARIES
CONSOLIDATED STATEMENTS OF STOCKHOLDERS’ EQUITY
(In thousands)
|
| | | | | | | | | | | | | | | | | | | | | | | | | | | |
| Common Stock Class A | | Common Stock Class B | | Additional Paid-in Capital | | Cumulative Translation Adjustment | | Accumulated Deficit | | Treasury Stock | | Total Stockholders’ Equity |
Balance, March 31, 2010 | $ | 528 |
| | $ | 147 |
| | $ | 398,756 |
| | $ | 645 |
| | $ | (309,043 | ) | | $ | (3,302 | ) | | $ | 87,731 |
|
Net income | — |
| | — |
| | — |
| | — |
| | 67,936 |
| | — |
| | 67,936 |
|
Translation adjustment | — |
| | — |
| | — |
| | 320 |
| | — |
| | — |
| | 320 |
|
Class B stock converted to Class A stock | 1 |
| | (1 | ) | | — |
| | — |
| | — |
| | — |
| | — |
|
Deconsolidation of Contineo | — |
| | — |
| | — |
| | — |
| | 253 |
| | — |
| | 253 |
|
Repurchase of subsidiary stock options | — |
| | — |
| | (36 | ) | | — |
| | — |
| | — |
| | (36 | ) |
Options exercised | 15 |
| | — |
| | 2,601 |
| | — |
| | — |
| | — |
| | 2,616 |
|
Purchase of treasury stock | (4 | ) | | — |
| | (5 | ) | | — |
| | — |
| | (552 | ) | | (561 | ) |
Restricted stock grant, net of forfeitures | 1 |
| | — |
| | — |
| | — |
| | — |
| | — |
| | 1 |
|
Stock-based compensation | — |
| | — |
| | 1,021 |
| | — |
| | — |
| | — |
| | 1,021 |
|
Balance, March 31, 2011 | $ | 541 |
| | $ | 146 |
| | $ | 402,337 |
| | $ | 965 |
| | $ | (240,854 | ) | | $ | (3,854 | ) | | $ | 159,281 |
|
Net income | — |
| | — |
| | — |
| | — |
| | 41,982 |
| | — |
| | 41,982 |
|
Translation adjustment | — |
| | — |
| | — |
| | (346 | ) | | — |
| | — |
| | (346 | ) |
Class B stock converted to Class A stock | 7 |
| | (7 | ) | | — |
| | — |
| | — |
| | — |
| | — |
|
Repurchase of subsidiary stock options | — |
| | — |
| | (117 | ) | | — |
| | — |
| | — |
| | (117 | ) |
Options exercised | 9 |
| | — |
| | 1,675 |
| | — |
| | — |
| | — |
| | 1,684 |
|
Purchase of treasury stock | (66 | ) | | — |
| | — |
| | — |
| | — |
| | (17,319 | ) | | (17,385 | ) |
Restricted stock grant, net of forfeitures | (1 | ) | | — |
| | — |
| | — |
| | — |
| | — |
| | (1 | ) |
Conversion of RSUs to restricted stock | 14 |
| | — |
| | (14 | ) | | — |
| | — |
| | — |
| | — |
|
Tax benefits related to stock-based compensation | — |
| | — |
| | 61 |
| | — |
| | — |
| | — |
| | 61 |
|
Stock-based compensation | — |
| | — |
| | 1,205 |
| | — |
| | — |
| | — |
| | 1,205 |
|
Balance, March 31, 2012 | $ | 504 |
| | $ | 139 |
| | $ | 405,147 |
| | $ | 619 |
| | $ | (198,872 | ) | | $ | (21,173 | ) | | $ | 186,364 |
|
Net loss | — |
| | — |
| | — |
| | — |
| | (44,038 | ) | | — |
| | (44,038 | ) |
Translation adjustment | — |
| | — |
| | — |
| | (11 | ) | | — |
| | — |
| | (11 | ) |
Options exercised | 2 |
| | — |
| | 85 |
| | — |
| | — |
| | — |
| | 87 |
|
Purchase of treasury stock | (58 | ) | | — |
| | — |
| | — |
| | — |
| | (12,675 | ) | | (12,733 | ) |
Restricted stock grant, net of forfeitures | 1 |
| | — |
| | — |
| | — |
| | — |
| | — |
| | 1 |
|
Conversion of RSUs to restricted stock | 1 |
| | — |
| | (1 | ) | | — |
| | — |
| | — |
| | — |
|
Stock-based compensation | — |
| | — |
| | 1,407 |
| | — |
| | — |
| | — |
| | 1,407 |
|
Balance, March 31, 2013 | $ | 450 |
| | $ | 139 |
| | $ | 406,638 |
| | $ | 608 |
| | $ | (242,910 | ) | | $ | (33,848 | ) | | $ | 131,077 |
|
The accompanying notes are an integral part of these Consolidated Financial Statements.
WESTELL TECHNOLOGIES, INC. AND SUBSIDIARIES
CONSOLIDATED STATEMENTS OF CASH FLOWS
(In thousands)
|
| | | | | | | | | | | |
| Fiscal Year Ended March 31, |
| 2013 | | 2012 | | 2011 |
Cash flows from operating activities: | | | | | |
Net income (loss) | $ | (44,038 | ) | | $ | 41,982 |
| | $ | 67,936 |
|
Reconciliation of net income (loss) to net cash provided by (used in) operating activities: | | | | | |
Depreciation and amortization | 1,381 |
| | 2,053 |
| | 2,700 |
|
Goodwill impairment | 2,884 |
| | — |
| | — |
|
Stock-based compensation | 1,407 |
| | 1,205 |
| | 1,021 |
|
Foreign currency transaction (gain) loss | — |
| | 17 |
| | (52 | ) |
Gain on CNS asset sale | — |
| | (31,654 | ) | | — |
|
Gain on sale of ConferencePlus, net of tax | — |
| | (20,489 | ) | | — |
|
(Gain) loss on sale or disposal of fixed assets | (8 | ) | | 18 |
| | 2 |
|
Gain on sale of non-operating asset | — |
| | (325 | ) | | — |
|
Restructuring | 149 |
| | 1,217 |
| | — |
|
Deferred taxes | 29,865 |
| | 12,438 |
| | (54,200 | ) |
Changes in assets and liabilities: | | | | | |
Accounts receivable | (979 | ) | | 12,396 |
| | (6,426 | ) |
Inventory | (2,002 | ) | | 1,852 |
| | 3,702 |
|
Prepaid expenses and other current assets | (233 | ) | | 1,002 |
| | 1,132 |
|
Other assets | (240 | ) | | (265 | ) | | 167 |
|
Deferred revenue | (128 | ) | | 336 |
| | (705 | ) |
Accounts payable and accrued expenses | 23 |
| | (23,820 | ) | | 8,522 |
|
Accrued compensation | (206 | ) | | (2,919 | ) | | 436 |
|
Net cash provided by (used in) operating activities | (12,125 | ) | | (4,956 | ) | | 24,235 |
|
Cash flows from investing activities: | | | | | |
Maturities of held-to maturity short-term debt securities | 16,817 |
| | 8,352 |
| | — |
|
Maturities of other short-term investments | 6,796 |
| | 1,370 |
| | 245 |
|
Purchases of held-to maturity short-term debt securities | (29,090 | ) | | (16,746 | ) | | — |
|
Purchases of other short-term investments | (4,417 | ) | | (6,941 | ) | | (735 | ) |
Purchases of property and equipment | (379 | ) | | (819 | ) | | (785 | ) |
Proceeds from sale of assets | 15 |
| | 325 |
| | — |
|
Proceeds from the sale of ConferencePlus, net of cash transferred | — |
| | 40,331 |
| | — |
|
Proceeds from CNS asset sale | — |
| | 36,729 |
| | — |
|
Payment for business acquisition | (2,524 | ) | | — |
| | — |
|
Changes in restricted cash | 4,951 |
| | (7,451 | ) | | — |
|
Net cash provided by (used in) investing activities | (7,831 | ) | | 55,150 |
| | (1,275 | ) |
Cash flows from financing activities: | | | | | |
Purchase of treasury stock | (12,733 | ) | | (17,385 | ) | | (561 | ) |
Excess tax benefits from stock-based compensation | — |
| | 145 |
| | — |
|
Proceeds from stock options exercised | 87 |
| | 1,684 |
| | 2,616 |
|
Repurchase of subsidiary stock options | — |
| | (117 | ) | | (36 | ) |
Net cash provided by (used in) financing activities | (12,646 | ) | | (15,673 | ) | | 2,019 |
|
Effect of exchange rate changes on cash | 3 |
| | (97 | ) | | 114 |
|
Net increase (decrease) in cash and cash equivalents | (32,599 | ) | | 34,424 |
| | 25,093 |
|
Cash and cash equivalents, beginning of period | 120,832 |
| | 86,408 |
| | 61,315 |
|
Cash and cash equivalents, end of period | $ | 88,233 |
| | $ | 120,832 |
| | $ | 86,408 |
|
Supplemental disclosures of cash flow information: | | | | | |
Cash paid (refunded) for income taxes, net | $ | (524 | ) | | $ | 2,901 |
| | $ | 874 |
|
The accompanying notes are an integral part of these Consolidated Financial Statements.
WESTELL TECHNOLOGIES, INC. AND SUBSIDIARIES
NOTES TO CONSOLIDATED FINANCIAL STATEMENTS
Note 1. Basis of Presentation:
Description of Business
Westell Technologies, Inc. (the “Company”) is a holding company. Its wholly owned subsidiary, Westell, Inc., designs and distributes telecommunications products which are sold primarily to major telecom service providers. Noran Tel, Inc. is a wholly owned subsidiary of Westell, Inc. The Company completed the plan to relocate the majority of its Noran Tel operations to the Company’s location in Aurora, Illinois, with the intent to optimize operations (the “Noran Tel relocation”). The relocation was completed in fiscal year 2013 and impacted approximately 35 employees located in Canada. Noran Tel's remaining Canadian operations focus on power distribution product development and sales of Westell products in Canada.
Business Acquisition
On May 15, 2012, the Company acquired certain assets and liabilities of ANTONE Wireless Corporation (“ANTONE”), including rights to ANTONE products, for $2.5 million cash, subject to an adjustment for working capital, plus contingent cash consideration of up to an additional $3.5 million (the "ANTONE acquisition"). The contingent consideration is based upon profitability of the acquired products for post-closing periods through June 30, 2016, and may be offset by working capital adjustments and indemnification claims. The acquisition included inventories, property and equipment, contract rights, customer relationships, technology, and certain specified operating liabilities that existed at the closing date. The Company hired nine of ANTONE’s employees. ANTONE products include high-performance tower-mounted amplifiers, multi-carrier power amplifier boosters, and cell-site antenna sharing products. The acquisition qualifies as a business combination and is accounted for using the acquisition method of accounting.
The results of ANTONE’s operations have been included in the Consolidated Financial Statements since the date of acquisition and are reported in the Westell operating segment. The Company incurred $0.1 million of related acquisition costs in fiscal year 2013 which are reflected in general and administrative costs in the Consolidated Statement of Operations.
In accordance with the acquisition method of accounting for business combinations, the Company allocated the total purchase price to identifiable tangible and intangible assets based on each element’s fair value. Purchased intangibles are amortized over their respective estimated useful lives. Goodwill recorded from this acquisition is the residual purchase price after allocating the total consideration to the preliminary fair value of assets acquired and liabilities assumed, and represents the expected synergies and other benefits from this acquisition that relates to the Company’s market position, customer relationships and supply chain capabilities. All goodwill recorded on the ANTONE acquisition is expected to be amortized and deductible for U.S. federal and state income tax purposes. The goodwill, which was evaluated under the Westell reporting segment, was determined to be impaired and therefore written off in the fourth quarter of fiscal year 2013. Refer to Note 4, Goodwill and Intangible Assets.
The following table summarizes the fair values of the assets and liabilities assumed as of the May 15, 2012, acquisition date: |
| | |
(in thousands) | |
Inventories | $326 |
Deposit | 3 |
|
Intangibles | 3,230 |
|
Liabilities | (612 | ) |
Goodwill | 2,086 |
|
Net assets acquired | $5,033 |
Cash consideration transferred | $2,524 |
Contingent consideration | 3,038 |
|
Working capital adjustment (shortfall) | (529 | ) |
Total preliminary consideration | $5,033 |
The identifiable intangible assets include $2.8 million designated to technology and $0.4 million designated to customer relationships, each with estimated useful lives of 8 years. The Company calculated values based on the present value of the
future estimated cash flows derived from operations attributable to technology and existing customer contracts and relationships. The $2.1 million of goodwill, which was evaluated under the Westell reporting segment, which is comprised of the entire business except the CNS segment, was determined to be impaired and therefore written off in the fourth quarter of fiscal year 2013. See Note 2, Summary of Significant Accounting Policies.
In the twelve months ended March 31, 2013, the Company recorded a $303,000 warranty obligation for pre-acquisition sales made by ANTONE related to a specific product failure. See Note 6, Product Warranties. Pre-acquisition warranty costs in excess of $25,000 are indemnified by the seller and have been adjusted in the valuation of the contingent consideration. Refer to further discussion of the contingent consideration in Note 13, Fair Value Measurements.
Sale of Conference Plus, Inc.
On December 31, 2011, the Company sold its wholly owned subsidiary, Conference Plus, Inc. including Conference Plus Global Services, Ltd (“CGPS”), a wholly owned subsidiary of ConferencePlus (collectively, “ConferencePlus”) to Arkadin for $40.3 million in cash (the “ConferencePlus sale”). Of the total purchase price, $4.1 million was placed in escrow at closing for one year as security for certain indemnity obligations of the Company. The Company subsequently agreed to extend the escrow period to June 10, 2013. During the three months ended December 31, 2012, the Company recorded a contingent liability of $1.5 million, pre-tax, relating to impending claims raised by Arkadin under the indemnity provisions of the purchase sales agreement. This, along with certain other adjustments, resulted in a $1.4 million loss for fiscal year 2013 and is presented in the table below. In the quarter ended March 31, 2013, $1.6 million of the escrow was released. The Company expects the cash held in escrow that is in excess of the obligation covered by the indemnity provisions to be released to the Company during fiscal year 2014. The escrow amount has been classified as restricted cash on the Consolidated Balance Sheets as of March 31, 2013, and March 31, 2012. The results of operations of ConferencePlus presented herein have been classified as discontinued operations. The Consolidated Statements of Cash Flows include discontinued operations.
During fiscal year 2012, the Company recorded an after-tax gain of $20.5 million on the ConferencePlus sale which is included in discontinued operations on the Consolidated Statement of Operations.
The gain on the sale is calculated as follows: |
| | | |
(in thousands) | |
Cash Proceeds | $ | 40,331 |
|
Less: Net value of assets and liabilities as of December 31, 2011, and transaction costs | (7,483 | ) |
Total gain before income taxes | 32,848 |
|
Income tax | (12,359 | ) |
Total gain, net of tax | $ | 20,489 |
|
ConferencePlus revenue and income before income taxes reported in discontinued operations is as follows:
|
| | | | | | | | | | | |
| Twelve months ended March 31, |
(in thousands) | 2013 | | 2012 | | 2011 |
Revenue | $ | — |
| | $ | 31,746 |
| | $ | 42,328 |
|
Income (loss) before income taxes | $ | (1,358 | ) | | $ | 3,509 |
| | $ | 4,868 |
|
CNS Asset Sale
On April 15, 2011, the Company sold certain assets and transferred certain liabilities of the Customer Networking Solutions (“CNS”) segment to NETGEAR, Inc. for $36.7 million in cash (the “CNS asset sale”). The Company retained a major CNS customer relationship and contract, and also retained the Homecloud product development program. The Company completed the remaining contractually required product shipments under the retained contract in December 2011.
As part of the agreement, the Company agreed to indemnify NETGEAR following the closing of the sale against specified losses in connection with the CNS business and generally retained responsibility for various legal liabilities that may accrue. An escrow balance of $3.4 million was established for one year for this purpose or for other claims and is reflected as restricted cash on the Consolidated Balance Sheet. NETGEAR made a $0.9 million claim against the escrow balance for a dispute and indemnity claim regarding an interpretation of the Asset Purchase Agreement. The Company had previously recorded a $0.4 million contingency reserve for this claim at the time of the sale and recorded an additional expense of $0.5 million during fiscal year 2013. In fiscal year 2013, the Company resolved the dispute through arbitration and the escrow was released with $2.6 million refunded to the Company and $0.9 million paid to NETGEAR.
During fiscal year 2012, the Company recorded a pre-tax gain of $31.7 million in connection with this asset sale. In connection with the CNS asset sale, the Company entered into a Master Services Agreement and an Irrevocable Site License Agreement under which the Company provided transition services and subleased office space to NETGEAR. The sublease expired in April 2012.
The pre-tax gain on the CNS asset sale for the twelve months ended March 31, 2012, is calculated as follows:
|
| | | |
(in thousands) | |
Cash Proceeds | $ | 36,729 |
|
Less: Net value of assets and liabilities sold or transferred as of April 15, 2011, and transaction costs | (5,075 | ) |
Total gain before income taxes | $ | 31,654 |
|
Principles of Consolidation
The accompanying Consolidated Financial Statements include the accounts of the Company and its wholly owned subsidiaries. The Consolidated Financial Statements have been prepared using accounting principles generally accepted in the United States (“GAAP”). All intercompany accounts and transactions have been eliminated in consolidation.
Use of Estimates
The preparation of financial statements in conformity with GAAP requires management to make estimates and assumptions that affect the reported amounts of assets and liabilities and disclosure of contingent assets and liabilities at the date of the financial statements, and that affect revenue and expenses during the periods reported. Estimates are used when accounting for the allowance for uncollectible accounts receivable, net realizable value of inventory, product warranty accrued, relative selling prices, stock-based compensation, goodwill and intangible assets fair value, depreciation, income taxes, and contingencies, among other things. Actual results could differ from those estimates.
Reclassifications
Certain amounts in the Consolidated Financial Statements for prior periods have been reclassified to conform to the current period presentation. Previously reported amounts in the Consolidated Statement of Operations have been adjusted for the effects of the discontinued operations described above. The reclassifications related to discontinued operations had no impact on previously reported amounts for total assets, total liabilities, total stockholders’ equity or net income (loss).
Note 2. Summary of Significant Accounting Policies:
Business Combinations
The Company applies the guidance of ASC topic 805, Business Combinations. This guidance requires the acquiring entity in a business combination to recognize the full fair value of assets acquired and liabilities assumed in transactions; established the acquisition date fair value as the measurement objective for all assets acquired and liabilities assumed; requires expensing of transaction and restructuring costs; and required the acquirer to disclose the information needed to evaluate and understand the nature and financial effect of the business combination.
Cash and Cash Equivalents
Cash and cash equivalents consist of highly liquid investments with maturities of three months or less when purchased and include bank deposits, money market funds and debt instruments consisting of pre-refunded municipal bonds. The pre-refunded municipal bonds are classified as held-to-maturity and are carried at amortized cost. Money market funds are accounted for as available-for-sale securities under the requirements of ASC topic 320, Investments – Debt and Equity Securities (“ASC 320”).
Short-term Investments
Certificates of deposit held for investment with an original maturity greater than 90 days are carried at cost and reported as Short-term investments on the Consolidated Balance Sheets. The certificates of deposit are not debt securities. The Company also invests in debt instruments consisting of pre-refunded municipal bonds. The income and principal from these pre-refunded bonds are secured by an irrevocable trust holding U.S Treasury securities. The bonds have original maturities of greater than 90 days, but have remaining maturities of less than one year. The pre-refunded municipal bonds are classified as held-to-maturity and are carried at amortized cost.
Accounts Receivable
Trade accounts receivable are recorded at the invoiced amount and typically do not bear interest. The Company provides allowances for doubtful accounts related to accounts receivable for estimated losses resulting from the inability of its customers to make required payments. The Company takes into consideration the overall quality of the receivable portfolio along with specifically identified customer risks.
Concentrations of Credit Risk
Financial instruments that potentially subject the Company to concentrations of credit risk consist principally of cash equivalents, short-term investments, and trade receivables. The Company currently invests its excess cash in money market funds, certificates of deposit and debt investments consisting of pre-refunded municipal bonds that are secured by an irrevocable trust holding U.S. Treasury securities.
Earnings (Loss) per Share
The computation of basic net income (loss) per share is computed using the weighted-average number of common shares outstanding during the period. Diluted net income per share includes the number of additional common shares that would have been outstanding if the dilutive potential shares had been issued. In periods with a net loss, all common stock equivalents are excluded from the per share calculation; therefore, the basic loss per share equals the diluted loss per share.
Inventories
Inventories are stated at the lower of first-in, first-out (“FIFO”) cost or market value. The components of inventories are as follows: |
| | | | | | | |
| March 31, |
(in thousands) | 2013 | | 2012 |
Raw material | $ | 7,021 |
| | $ | 5,290 |
|
Finished goods | 7,234 |
| | 6,095 |
|
Reserve for excess and obsolete inventory and net realizable value | (2,032 | ) | | (1,479 | ) |
Total inventories | $ | 12,223 |
| | $ | 9,906 |
|
The Company reviews inventory for excess quantities and obsolescence based on its best estimates of future demand, product lifecycle status and product development plans. The Company uses historical information along with these future estimates to reserve for obsolete and potentially obsolete inventory. The Company also evaluates inventory to adjust valuations to be the lower of cost or market value. Prices anticipated for future inventory demand are compared to current and committed inventory values.
Prepaid Expenses and Other Current Assets
Prepaid and current assets generally consisting of prepaid product royalty, prepaid maintenance agreements and prepaid rent, which are amortized as expense generally over the term of the underlying contract or estimated product life.
Property and Equipment
Property and equipment are stated at cost, net of depreciation. Depreciation is computed using the straight-line method over the estimated useful lives of the assets, or for leasehold improvements, the shorter of the remaining lease term or the estimated useful life. Expenditures for major renewals and improvements that extend the useful life of property and equipment are capitalized. The following table shows estimated useful lives of property and equipment, as follows:
|
| | | |
Machinery and equipment | 5 | - | 7 years |
Office, computer and research equipment | 2 | - | 5 years |
Depreciation expense from continuing operations was $0.5 million, $0.5 million and $0.7 million for fiscal years 2013, 2012 and 2011, respectively. In accordance with ASC topic 360, Property, Plant and Equipment (“ASC 360”), the Company assesses all of its long-lived assets, including intangibles, for impairment when impairment indicators are identified. If the carrying value of an asset exceeds its undiscounted cash flows, an impairment loss may be necessary. An impairment loss is calculated as the difference between the carrying value and the fair value of the asset. No impairment losses were recorded in fiscal years 2013, 2012, or 2011.
Goodwill and Other Intangibles
Goodwill is not amortized, but it is tested for impairment at the reporting unit level by first performing a qualitative approach to test goodwill for impairment to determine whether it is more likely than not that the fair value of a reporting unit is less than its carrying value. If it is concluded that this is the case, it is necessary to perform the two-step, quantitative, goodwill impairment test. Otherwise, the two-step goodwill impairment test is not required.
Goodwill and indefinite-lived intangible assets are reviewed for impairment at least annually or when an event occurs or circumstances change between annual tests that would more likely than not reduce the fair value of the reporting unit below its carrying value. The Company performs its annual impairment test in the fourth quarter of each fiscal year and begins with a qualitative assessment to determine if it is more likely than not that the fair value of a reporting unit is less than its carrying value.
If the Company concludes that it is more likely than not that the fair value of a reporting unit is less than its carrying value, it is necessary to perform a two-step goodwill impairment test. The first step tests for impairment by applying fair value-based tests at the reporting unit level. Fair value of a reporting unit is determined by using both an income approach and a market approach, because this combination is considered to produce the most reasonable indication of fair value in an orderly transaction between market participants. Under the income approach, the Company determines fair value based on estimated future cash flows of a reporting unit, discounted by an estimated weighted-average cost of capital, which reflects the level of risk inherent in a reporting unit and its associated estimates of future cash flows as well as the rate of return an experienced investor might expect to earn. Under the market approach, the Company utilizes valuation multiples derived from publicly available information for comparable companies to provide an indication of how much a knowledgeable investor in the marketplace might be willing to pay for a company. The second step (if necessary) measures the amount of impairment by applying fair-value-based tests to individual assets and liabilities within each reporting unit.
If the Company concludes that it is more likely than not that the fair value of an indefinite-lived intangible asset is less than its carrying value, a quantitative fair value assessment is performed and compared to the carrying value. If the fair value is less than the carrying value, impairment is recorded.
Intangible assets with determinable lives are amortized on a straight-line basis over their respective estimated useful lives. If the Company were to determine that a change to the remaining estimated useful life of an intangible asset was necessary, then the remaining carrying amount of the intangible asset would be amortized prospectively over that revised remaining useful life. On an ongoing basis, the Company reviews intangible assets with a definite life and other long-lived assets other than goodwill for impairment whenever events and circumstances indicate that carrying values may not be recoverable. If such events or changes in circumstances occur, the Company will recognize an impairment loss if the undiscounted future cash flow expected to be generated by the asset is less than the carrying value of the related asset. Any impairment loss would adjust the asset to its implied fair value.
Revenue Recognition and Deferred Revenue
The Company records revenue from sales transactions when title and risk of loss are passed to the customer, there is persuasive evidence of an arrangement for sale, delivery has occurred and/or services have been rendered, the sales price is fixed or determinable, and collectability is reasonably assured.
Revenue recognition on equipment where software is incidental to the product as a whole, or where software is essential to the equipment’s functionality and falls under software accounting scope exceptions, generally occurs when products are shipped, risk of loss has transferred to the customer, objective evidence exists that customer acceptance provisions have been met, no significant obligations remain, collection is reasonably assured and warranty can be estimated.
Where multiple element arrangements exist, fair value of each element is established using the relative selling price method, which requires the Company to use vendor-specific objective evidence (“VSOE”), reliable third-party objective evidence (“TPE”) or management’s best estimate of selling price, in that order.
The Company’s product return policy allows customers to return unused equipment for partial credit if the equipment is non-custom product, is returned within specified time limits, and is currently being manufactured and sold. Credit is not offered on returned products that are no longer manufactured and sold. The Company’s reserve for returns is not significant. The Company’s ConferencePlus segment, which is shown in discontinued operations, recognized revenue for conference calls and other services upon completion of the conference call or services.
The Company records revenue net of taxes in accordance with ASC topic 605, Revenue Recognition (“ASC 605”).
Shipping and Handling
Freight billed to customers is recorded as revenue. The Company recorded costs related to shipping and handling expense of $0.7 million, $0.7 million and $1.1 million in sales and marketing expense for the fiscal years 2013, 2012 and 2011, respectively.
Product Warranties
Most of the Company’s products carry a limited warranty of up to seven years. The Company accrues for estimated warranty costs as products are shipped based on historical sales and cost of repair or replacement trends relative to sales. See Note 6 for further discussion of the Company’s product warranties.
Research and Development Costs
Engineering and product research and development costs are charged to expense as incurred.
Stock-based Compensation
The Company recognizes stock-based compensation expense for all employee stock-based payments based upon the fair value on the award’s grant date over the requisite service period. Determining the fair value of equity-based options requires the Company to estimate the expected volatility of its stock, the risk-free interest rate, expected option term, expected dividend yield and expected forfeitures. See Note 8 for further discussion of the Company’s stock-based compensation plans.
Fair Value Measurements
The Company accounts for the fair value of assets and liabilities in accordance with ASC topic 820, Fair Value Measurements and Disclosures (“ASC 820”). ASC 820 defines fair value and establishes a framework for measuring fair value as required by other accounting pronouncements. See Note 13 for further discussion of the Company’s fair value measurements.
Foreign Currency Translation and Transaction
The Company’s primary foreign currency exposure is to changes in exchange rates for the U.S. dollar versus the Canadian dollar and the related effects on receivables and payables denominated in Canadian dollars. The Company’s foreign subsidiary, Noran Tel, is located in Canada. In the quarter ended September 30, 2012, the Company completed the relocation of the production of products from Canada to its headquarters in Aurora, IL. Noran Tel has five remaining employees located in Canada and is now focused on the development of power distribution products and the sale of Westell products in Canada. Noran Tel is funded by the U.S. operations. On August 1, 2012, the functional currency for Noran Tel was changed from the Canadian dollar to the U.S. dollar. The Company will continue to have revenue and expenses denominated in Canadian currency, but it is no longer exposed to gains and losses from fluctuations affecting net investments and earnings of Noran Tel. The Canadian entity revenues, which are denominated in U.S. dollars, are solely from its parent, Westell Inc., located in the U.S. As of March 31, 2013, and March 31, 2012, the balance in the cumulative foreign currency translation adjustment account, which is a component of stockholders’ equity, was an unrealized gain of $0.6 million and $0.6 million, respectively.
The Company records transaction gains (losses) for fluctuations on foreign currency rates on accounts receivable, accounts payable, and cash as a component of other income (expense), net on the Consolidated Statements of Operations.
Income Taxes
The Company accounts for income taxes under the provisions of ASC topic 740, Income Taxes (“ASC 740”). ASC 740 requires an asset and liability based approach in accounting for income taxes. Deferred income tax assets, including net operating loss (“NOL”) and certain tax credit carryovers and liabilities, are recorded based on the differences between the financial statement and tax bases of assets and liabilities, applying enacted statutory tax rates in effect for the year in which the tax differences are expected to reverse. Valuation allowances are provided against deferred tax assets which are assessed as not likely to be realized. On a quarterly basis, management evaluates the recoverability of deferred tax assets and the need for a valuation allowance. This evaluation requires the use of estimates and assumptions and considers all positive and negative evidence and factors, such as the scheduled reversal of temporary differences, the mix of earnings in the jurisdictions in which the Company operates, and prudent and feasible tax planning strategies. Deferred tax assets and liabilities are adjusted for the effects of changes in tax laws and rates on the dates of enactment. The Company accounts for unrecognized tax benefits based upon its assessment of whether a tax benefit is more likely than not to be sustained upon examination by tax authorities. The Company reports a liability for unrecognized tax benefits resulting from unrecognized tax benefits taken or expected to be taken in a tax return and recognizes interest and penalties, if any, related to its unrecognized tax benefits in income tax expense. See Note 3 for further discussion of the Company’s income taxes.
New Accounting Standards Adopted
In July 2012, the FASB issued ASU No. 2012-02, Intangibles-Goodwill and Other (topic 350): Testing Indefinite-Lived Intangible Assets for Impairment (“ASU 2012-02”). ASU 2012-02 provides entities with an option to first assess qualitative factors to determine whether events or circumstances indicate that it is more likely than not that the indefinite-lived intangible asset is impaired. If an entity concludes that it is more than 50% likely that an indefinite-lived intangible asset is not impaired, no further analysis is required. However, if an entity concludes otherwise, it would be required to determine the fair value of the indefinite-lived intangible asset to measure the amount of actual impairment, if any, as currently required under U.S. GAAP. ASU 2012-02 is effective for fiscal years beginning after September 15, 2012. The adoption of this pronouncement did not materially impact the Company’s financial condition or results of operations.
Note 3. Income Taxes:
The income tax expenses (benefits) from continuing operations are summarized as follows:
|
| | | | | | | | | | | |
| Fiscal Year Ended March 31, |
(in thousands) | 2013 | | 2012 | | 2011 |
Federal: | |
Current | $ | — |
| | $ | (775 | ) | | $ | 685 |
|
Deferred | 24,578 |
| | 9,604 |
| | (53,606 | ) |
| 24,578 |
| | 8,829 |
| | (52,921 | ) |
State: | | | | | |
Current | 2 |
| | 1,219 |
| | (130 | ) |
Deferred | 4,797 |
| | 2,770 |
| | (288 | ) |
| 4,799 |
| | 3,989 |
| | (418 | ) |
Foreign: | | | | | |
Current | (8 | ) | | 50 |
| | 71 |
|
Deferred | 23 |
| | 7 |
| | (36 | ) |
| 15 |
| | 57 |
| | 35 |
|
Total | $ | 29,392 |
| | $ | 12,875 |
| | $ | (53,304 | ) |
The statutory federal income tax rate is reconciled to the Company's effective income tax rates below:
|
| | | | | | | | |
| Fiscal Year Ended March 31, |
| 2013 | | 2012 | | 2011 |
Statutory federal income tax rate | 34.0 | % | | 35.0 |
| | 35.0 | % |
Meals and entertainment | (0.2 | ) | | 0.1 |
| | 0.3 |
|
State income tax, net of federal tax effect | 3.1 |
| | 3.1 |
| | 4.0 |
|
Valuation allowance | (241.3 | ) | | 5.3 |
| | (591.7 | ) |
Goodwill impairment | (1.9 | ) | | — |
| | — |
|
Deferred tax adjustments | 0.5 |
| | 2.6 |
| | 14.7 |
|
Contingent tax reserves | — |
| | (6.3 | ) | | (4.0 | ) |
Other | (2.6 | ) | | 0.1 |
| | (1.3 | ) |
| (208.4 | )% | | 39.9 | % | | (543.0 | )% |
Components of the net deferred income tax assets are as follows: |
| | | | | | | |
| March 31, |
(in thousands) | 2013 | | 2012 |
Deferred income tax assets: | |
Allowance for doubtful accounts | $ | 4 |
| | $ | 3 |
|
Alternative minimum tax credit carryforward | 697 |
| | 697 |
|
Foreign tax credit carryforward | 674 |
| | 718 |
|
Research and development credit carryforward | 2,735 |
| | 3,451 |
|
Depreciation | 1,224 |
| | 1,286 |
|
Compensation accruals | 1,326 |
| | 1,186 |
|
Inventory reserves | 888 |
| | 575 |
|
Warranty reserves | 57 |
| | 90 |
|
Net operating loss carryforward | 29,315 |
| | 25,874 |
|
Intangibles and goodwill | 689 |
| | 172 |
|
Other | 1,105 |
| | 518 |
|
| 38,714 |
| | 34,570 |
|
Valuation allowance | (36,285 | ) | | (2,253 | ) |
Net deferred income tax assets | $ | 2,429 |
| | $ | 32,317 |
|
Classified in Consolidated Balance Sheets as follows:
|
| | | | | | | |
| March 31, |
(in thousands) | 2013 | | 2012 |
Deferred income tax assets | $ | 2,735 |
| | $ | 32,599 |
|
Deferred income tax liability – included in other long-term liabilities | (306 | ) | | (282 | ) |
Net deferred income tax assets | $ | 2,429 |
| | $ | 32,317 |
|
In addition to the deferred tax assets listed in the table above, the Company has $1.0 million and $0.9 million of unrecorded tax benefits at March 31, 2013, and March 31, 2012, respectively, primarily attributable to the difference between the amount of the financial statement expense and the allowable tax deduction for stock issued under the Company’s stock compensation plans. Although not recognized for financial reporting purposes, this unrecognized tax benefit is available to reduce future income and is incorporated as a reduction to the Company’s federal and state NOL carry forwards, which are discussed below.
The Company utilizes the liability method of accounting for income taxes and deferred taxes which are determined based on the differences between the financial statements and tax bases of assets and liabilities given the provisions of the enacted tax laws. The Company evaluates the need for valuation allowances on the net deferred tax assets under the rules of ASC 740 Income Taxes. In assessing the realizability of the deferred tax assets, the Company considered whether it is more likely than not that some portion or all of the deferred tax assets will not be realized through the generation of future taxable income. In making this determination, the Company assessed all of the evidence available at the time including recent earnings, the then forecasted income projections, and historical financial performance.
In fiscal year 2013, the Company considered both the positive and negative evidence available to assess the realizability of its deferred tax assets. The Company considered negative factors which included recent losses and a forecasted three-year cumulative loss position, as well as positive evidence consisting primarily of projected future earnings. The Company concluded that the negative evidence outweighed the objectively verifiable positive evidence. As a result, the Company increased the valuation allowance against deferred income tax assets by $34.0 million, which taken together with the liability for uncertain tax positions, has the effect of reserving in full all of the Company's deferred tax assets as of March 31, 2013.
In fiscal year 2012, the Company sold its ConferencePlus subsidiary and completed the CNS asset sale. These events resulted in a $64.5 million taxable gain in fiscal year 2012 and changed the outlook for future taxable income, positively with regards to the CNS business which contributed to the majority of the Company’s historical losses and negatively in certain states where income generated by ConferencePlus was apportioned. In addition, certain states for which the Company has net operating loss carryforwards, such as Illinois, suspended the use of those carryforwards. The Company therefore was not able to utilize those carryforwards to offset fiscal year 2012 taxable income. The Company considered both the positive and negative evidence and established a forecast of future taxable income to evaluate the deferred tax assets for realizability. On this basis, the Company concluded that it was more likely than not that it would be able to utilize the majority of its deferred tax assets, but that certain
state net operating loss carryforwards would expire prior to utilization. As a result, the Company increased the valuation allowance reserve by $1.7 million to $2.3 million in fiscal year 2012. In addition, the Company recognized $2.1 million of net tax benefits relating to the change in uncertain tax positions. The Company also changed the federal rate used on deferred taxes from 35% to 34%. This change resulted in a $0.6 million tax expense.
In fiscal year 2011, after considering both the positive and negative evidence, including improved financial performance, expected future taxable income, the exit from a three-year cumulative loss, and the sale of the majority of its CNS business for a $31.7 million taxable gain, the Company concluded that it was more likely than not that it would be able to utilize the majority of its deferred tax assets. Prior to fiscal year 2011, a full valuation allowance on deferred tax assets was in place. As a result of the fiscal year 2011 assessment of realizability of deferred tax assets and current year income, the valuation allowance decreased by $60.8 million, which was recorded as an income tax benefit in fiscal year 2011. The Company also recognized an additional $0.7 million of tax benefits relating to changes in or expirations of uncertain tax positions.
The Company has approximately $4.1 million in tax credit carryforwards and $73.8 million of federal net operating loss carryforwards that are available to offset taxable income in the future. The tax credit carryforwards will begin to expire in fiscal year 2020. The federal net operating loss carryforwards begin to expire in fiscal year 2023. State net operating loss carryforwards, net of federal tax benefits, are $5.3 million and have varying carryforward periods of from 5 to 20 years.
An income tax benefit of $0.1 million related to stock-based compensation was credited to additional paid-in-capital during fiscal year 2012. No related benefit was recorded in fiscal years 2013 or 2011.
The Company accounts for uncertainty in income taxes under ASC 740, which prescribes a recognition threshold and measurement of a tax position taken or expected to be taken in a tax return. ASC 740 also provides guidance on derecognition, classification, interest and penalties, accounting in interim periods, disclosure and transition.
A reconciliation of the beginning and ending balances of the total amounts of unrecognized tax benefits for fiscal years 2012 and 2013 is as follows:
|
| | | |
(in thousands) | |
Unrecognized tax benefits at March 31, 2011 | $ | 6,259 |
|
Additions based on positions related to fiscal year 2012 | — |
|
Additions for tax positions of years prior to fiscal year 2012 | 32 |
|
Reductions for tax positions of years prior to fiscal year 2012 | (8 | ) |
Reductions as a result of expirations of applicable statutes of limitations | (699 | ) |
Settlements | (2,101 | ) |
Unrecognized tax benefits at March 31, 2012 | $ | 3,483 |
|
Additions based on positions related to fiscal year 2013 | — |
|
Additions for tax positions of years prior to fiscal year 2013 | 1 |
|
Reductions for tax positions of years prior to fiscal year 2013 | — |
|
Reductions as a result of expirations of applicable statutes of limitations | (716 | ) |
Settlements | — |
|
Unrecognized tax benefits at March 31, 2013 | $ | 2,768 |
|
The unrecognized tax benefits are presented in other long-term liabilities on the Consolidated Balance Sheets.
If the unrecognized tax benefit balances at March 31, 2013, and 2012, were recognized, it would affect the effective tax rate. During fiscal year 2012, $2.1 million of unrecognized tax benefits was recognized as income because the item was settled.
The Company recognized interest and penalties of $12,000, $14,000 and $(28,000) as a component of income tax expense as of March 31, 2013, 2012, and 2011, respectively. Interest and penalty credits result from reductions in uncertain tax positions. As of March 31, 2013, and March 31, 2012, accrued interest and penalties was $9,000 and $7,000, respectively.
The Company files its tax returns as prescribed by the tax laws of the jurisdictions in which it operates.
With few exceptions, the major jurisdictions subject to examination by the relevant taxable authorities, and open tax years, stated as the Company's fiscal years, are as follows: |
| | | |
Jurisdiction | Open Tax Years |
U.S. Federal | 2009 | - | 2013 |
U.S. State | 2008 | - | 2013 |
Foreign | 2008 | - | 2013 |
Note 4. Goodwill and Intangible Assets:
Goodwill
The Company is required to perform an evaluation of goodwill on an annual basis or more frequently if circumstances indicate a potential impairment. The annual test for impairment is conducted in the fourth quarter of each fiscal year. The Company performs a qualitative assessment of a reporting unit's fair value to determine whether it is more likely than not the fair value of a reporting unit is less than its carrying value. If it is concluded that this is the case, it is necessary to perform the two-step, quantitative, goodwill impairment test. The first step compares the fair value of a reporting unit with its carrying amount, including goodwill. If the carrying amount of a reporting unit exceeds its fair value, the second step compares the implied fair value of reporting unit goodwill with the carrying amount of that goodwill to determine the amount of impairment loss. Fair value of a reporting unit is determined by using a both an income approach and a market approach, as this combination is considered to produce the most reasonable indication of the Company's fair value in an orderly transaction between market participants. Under the income approach, the Company determined fair value based on estimated future cash flows of a reporting unit, discounted by an estimated weighted-average cost of capital, which reflects the level of risk inherent in a reporting unit and its associated estimates of future cash flows as well as the rate of return an experienced investor might expect to earn. Under the market approach, the Company utilized valuation multiples derived from publicly available information for guideline companies to provide an indication of how much a knowledgeable investor in the marketplace might be willing to pay for a company. The valuation multiples were applied to the reporting unit. Determining the fair value of a reporting unit is judgmental in nature and requires the use of significant estimates and assumptions, including estimates for revenue growth, operating expenses, gross margins, operating margins, discount rates and future market conditions, among others.
Prior to the relocation of Noran Tel production and revenue to Westell Inc., the Company's reporting units, for the purpose of evaluating goodwill, consisted of Noran Tel, Westell, and CNS. After the Noran Tel relocation, the Company evaluates the performance and goodwill for the combined reporting units consisting of Noran Tel and Westell. The combined unit is the same as the Westell segment. The CNS reporting unit does not carry any goodwill.
January 1, 2013 Evaluation
The Company performed its annual evaluation of goodwill as of January 1, 2013. The Company assessed whether it was more likely than not that combined Westell/Noran Tel fair value was less than its carrying amount including goodwill by considering the following factors: macroeconomic conditions, industry and market considerations, financial market considerations, and overall financial performance. Based on these factors, the Company determined it was necessary to perform a two-step goodwill impairment test. The first step of a two-step evaluation performed by the Company tested for impairment by applying a fair value-based test at the reporting unit level. The Company's step-one evaluation indicated impairment. Upon completing the step-two analysis, the Company determined that, pursuant to the standards applied, the full carrying amount of goodwill of $2.9 million was impaired. As a consequence, the Company recorded a charge during the fourth quarter of fiscal 2013 for the full carrying value of the goodwill. The Company did not recognize any impairment loss on goodwill in fiscal years 2012 or 2011.
Changes in the carrying amounts of goodwill by reporting units are as follows:
|
| | | | | | | | | | | | | | | | | | | |
(in thousands) | ConferencePlus | | ConferencePlus Global Services | | Noran Tel | | Westell | | Total |
Gross goodwill | $ | 1,052 |
| | $ | 322 |
| | $ | 1,890 |
| | $ | 9,651 |
| | $ | 12,915 |
|
Accumulated impairment | — |
| | — |
| | (1,381 | ) | | (9,651 | ) | | (11,032 | ) |
Currency translation | — |
| | — |
| | 314 |
| | — |
| | 314 |
|
April 1, 2011 balance, net | 1,052 |
| | 322 |
| | 823 |
| | — |
| | 2,197 |
|
ConferencePlus sale | (1,052 | ) | | (322 | ) | | — |
| | — |
| | (1,374 | ) |
Currency translation | — |
| | — |
| | (22 | ) | | — |
| | (22 | ) |
March 31, 2012 balance, net | — |
| | — |
| | 801 |
| | — |
| | 801 |
|
Noran Tel relocation | — |
| | — |
| | (798 | ) | | 798 |
| | — |
|
ANTONE acquisition | — |
| | — |
| | — |
| | 2,086 |
| | 2,086 |
|
Impairment | — |
| | — |
| | — |
| | (2,884 | ) | | (2,884 | ) |
Currency translation | — |
| | — |
| | (3 | ) | | — |
| | (3 | ) |
March 31, 2013 balance, net | $ | — |
| | $ | — |
| | $ | — |
| | $ | — |
| | $ | — |
|
Goodwill decreased $0.8 million during fiscal 2013 with a $2.1 million increase resulting from the ANTONE acquisition and with a $2.9 million decrease resulting from impairment. As of March 31, 2013, the Company had no goodwill.
Intangible Assets
The Company has an indefinite-lived intangible asset related to the Noran Tel trade name. To determine the fair value of the trade name, the Company calculates the present value of royalty income it could generate if the name was licensed in an arm’s length transaction to a third party. No impairment loss was recognized related to indefinite-lived assets in fiscal years 2013, 2012 or 2011.
Intangible assets with determinable lives are amortized on a straight-line basis over their respective estimated useful lives. If the Company were to determine that a change to the remaining estimated useful life of an intangible asset was necessary, then the remaining carrying amount of the intangible asset would be amortized prospectively over that revised remaining useful life. On an ongoing basis, the Company reviews intangible assets with a definite life and other long-lived assets other than goodwill for impairment whenever events and circumstances indicate that carrying values may not be recoverable. If such events or changes in circumstances occur, the Company will recognize an impairment loss if the undiscounted future cash flow expected to be generated by the asset is less than the carrying value of the related asset. Any impairment loss would adjust the asset to its implied fair value. In the fourth quarter of fiscal year 2013, indicators of impairment became present as a result of the Company's decision to write-down goodwill. The Company performed an evaluation to test intangible assets for recoverability and concluded that no impairment existed as of March 31, 2013. During the years ended March, 2013, 2012 and 2011, no impairment existed with respect to the Company's intangible assets with determinable lives and no significant changes to the remaining useful lives were necessary.
The following table presents details of the Company’s intangibles from historical acquisitions, including the fiscal year 2013 ANTONE acquisition: |
| | | | | | | |
| March 31, |
(in thousands) | 2013 | | 2012 |
Gross intangible assets | $ | 42,190 |
| | $ | 39,062 |
|
Accumulated amortization | (13,458 | ) | | (12,566 | ) |
Impairment | (23,868 | ) | | (23,868 | ) |
Currency translation | 199 |
| | 202 |
|
ConferencePlus sale | — |
| | (102 | ) |
Net carrying amount | $ | 5,063 |
| | $ | 2,728 |
|
The finite-lived intangibles are being amortized over periods of five to ten years. Finite-lived intangible amortization expense from continuing operations was $0.9 million, $0.5 million and $0.5 million in fiscal years 2013, 2012 and 2011. The following is the expected future amortization by fiscal year:
|
| | | | | | | | | | | | | | | | | | | | | | | |
(in thousands) | 2014 | | 2015 | | 2016 | | 2017 | | 2018 | | thereafter |
Intangible amortization expense | $ | 943 |
| | $ | 941 |
| | $ | 846 |
| | $ | 553 |
| | $ | 499 |
| | $ | 929 |
|
Net carrying amounts of intangible assets are as follows: |
| | | | | | | |
| March 31, |
(in thousands) | 2013 | | 2012 |
Finite-lived intangible assets: | | | |
Product technology (1) | $ | 2,832 |
| | $ | 464 |
|
Customer relationships (1) | 1,879 |
| | 1,912 |
|
Total finite-lived intangible assets, net | $ | 4,711 |
| | $ | 2,376 |
|
Infinite-lived intangible assets: | | | |
Trade Name | 352 |
| | 352 |
|
Total intangible assets | $ | 5,063 |
| | $ | 2,728 |
|
| |
(1) | Change due to amortization and adjustments due to foreign currency translation. |
Note 5. Commitments and Contingencies:
Obligations
The Company leases a 185,000 square foot corporate facility in Aurora, Illinois, to house product distribution, engineering, sales, marketing, manufacturing and administration pursuant to a lease that originated in 1997 and runs through September, 2017. The rental payments are currently $2.0 million a year and increase 2% every other year. In accordance with FASB Technical Bulletin 88-1, Issues Related to Accounting of Leases, as codified in ASC topic 840, Leases (“ASC 840”), the Company recorded a long-term deferred lease liability of $551,000 and $665,000 presented in other long-term liabilities and a short-term deferred lease liability of $114,000 and $94,000 presented in accrued expenses on the Consolidated Balance Sheets as of March 31, 2013, and 2012, respectively, to account for the straight-line impact on the rental payments. The Company leases two other offices, each approximately 2,500 square feet located in Goleta, CA and Regina, Canada. The Goleta lease is short-term and the Regina lease runs through October, 2017. The leases require the Company to pay utilities, insurance and real estate taxes on the facilities. Total rent expense for all facilities was $2.3 million, $2.2 million and $2.0 million for fiscal years 2013, 2012 and 2011, respectively. In fiscal years 2013 and 2012, rent expense was offset by $0.1 million and $0.4 million of sublease income, respectively.
Purchase obligations consist of inventory that arises in the normal course of business operations. Future obligations and commitments as of March 31, 2013 consisted of the following:
|
| | | | | | | | | | | | | | | | | | | | | | | | | | | |
| Payments due by fiscal year |
(in thousands) | 2014 | | 2015 | | 2016 | | 2017 | | 2018 | | Thereafter | | Total |
Purchase obligations | $ | 6,542 |
| | $ | — |
| | $ | — |
| | $ | — |
| | $ | — |
| | $ | — |
| | $ | 6,542 |
|
Future minimum lease payments for operating leases | 2,608 |
| | 2,111 |
| | 2,131 |
| | 2,152 |
| | 1,076 |
| | — |
| | 10,078 |
|
Future obligations and commitments | $ | 9,150 |
| | $ | 2,111 |
| | $ | 2,131 |
| | $ | 2,152 |
| | $ | 1,076 |
| | $ | — |
| | $ | 16,620 |
|
Litigation and Contingency Reserves
The Company and its subsidiaries are involved in various assertions, claims, proceedings and requests for indemnification concerning intellectual property, including patent infringement suits involving technologies that are incorporated in the Company’s products, which are being handled and defended in the ordinary course of business. These matters are in various stages of investigation and litigation, and are being vigorously defended. The Company is also subject to audit by tax authorities in various jurisdictions. Although the Company does not expect that the outcome in any of these matters, individually or collectively, will have a material adverse effect on its financial condition or results of operations, litigation is inherently unpredictable and therefore the Company is sometimes unable to make a reasonable estimate or range of estimates of the potential liability. Therefore, judgments could be rendered or settlements entered, which could adversely affect the Company’s operating results or cash flows in a particular period. The Company routinely assesses all of its litigation and threatened litigation as to the probability of ultimately incurring a liability, and it records its best estimate of the ultimate loss in situations where it assesses the likelihood of loss as probable. As of March 31, 2013, and March 31, 2012, the Company has not recorded any contingent liability attributable to existing litigation.
Wi-LAN Inc. v. Westell Technologies, Inc. et al.
In October 2007, Wi-LAN Inc. (“Wi-LAN”), a patent-holding company existing under the laws of Canada, filed two complaints against the Company, amongst other defendants, in the U.S. District Court for the Eastern District of Texas, Marshall Division. In the complaint, Wi-LAN alleged that certain of the Company’s products infringe U.S. patent numbers 5,282,222 and RE37,802. Wi-LAN sought monetary damages and other relief. In February 2011, the Company settled the lawsuit with the plaintiff. The settlement agreement was not material to the Company and concludes the lawsuit.
As of March 31, 2013, and March 31, 2012, the Company had total contingency reserves of $1.7 million and $0.8 million, respectively, related to certain intellectual property and indemnification claims. The contingency reserves are classified as accrued expenses on the Consolidated Balance Sheets.
As of March 31, 2013, and March 31, 2012, the Company had $1.7 million and $0.4 million, respectively, of the contingency reserves related to the discontinued operations of ConferencePlus. The $1.3 million increase in fiscal year 2013 related to impending indemnity claims related to the discontinued operation of ConferencePlus.
In the quarter ended December 31, 2012, the Company resolved, through arbitration, a dispute with NETGEAR regarding an interpretation of the Asset Purchase Agreement covering the CNS asset sale at a cost of $0.9 million. As of March 31, 2012, the Company had a $0.4 million contingency reserve for this claim and recorded an additional expense of $0.5 million during the three months ended September 30, 2012. All amounts have been paid as of March 31, 2013.
Additionally, as of March 31, 2013, the Company had contingent cash consideration payable related to the ANTONE acquisition. The ANTONE contingent consideration becomes payable based upon the profitability of the acquired products for post-closing periods through June 30, 2016, and is offset by working capital adjustments and certain indemnification claims. The maximum earn-out that could be paid before offsets was $3.5 million. As of March 31, 2013, the fair value of the contingent consideration liability, after an offset for a working capital adjustment and an indemnification claim for warranty obligations, is $2.3 million (see Notes 1, 5 and 12).
Note 6. Product Warranties:
Most of the Company’s products carry a limited warranty of up to seven years. The specific terms and conditions of those warranties vary depending upon the customer and the product sold. Factors that enter into the estimate of the Company’s warranty reserve include: the number of units shipped historically, anticipated rates of warranty claims, and cost per claim. The Company periodically assesses the adequacy of its recorded warranty liability and adjusts the reserve as necessary. In fiscal year 2011, the Company modified its policy of replacing CNS segment product to repairing product. The change resulted in a reduction in the cost per claim previously accrued. In addition, the actual number of CNS segment units that were serviced under warranty decreased in fiscal years 2011 and 2012, resulting in lower forecasted future warranty claims. The impact of those changes resulted in a change in estimate and a lower warranty reserve. The change in estimate is shown as a credit in warranty expense in the table below. In fiscal year 2013, the Company recorded a $303,000 warranty obligation for pre-acquisition sales made by ANTONE related to a specific product failure. As of March 31, 2013, the warranty reserve includes $2,000 related to this specific obligation. A corresponding indemnification claim of $303,000 for this warranty obligation has been adjusted in the valuation of the contingent consideration related to the ANTONE acquisition (see Note 1, Note 5, and Note 13). The current portions of the warranty reserve were $94,000 and $110,000 as of March 31, 2013, and 2012, respectively, and are presented on the Consolidated Balance Sheets as accrued expenses. The long-term portions of the warranty reserve were $58,000 and $133,000 as of March 31, 2013, and 2012, respectively, and are presented on the Consolidated Balance Sheets as other long-term liabilities.
The following table presents the changes in our product warranty reserve:
|
| | | | | | | | | | | |
| Fiscal Year Ended March 31, |
(in thousands) | 2013 | | 2012 | | 2011 |
Total product warranty reserve at the beginning of the period | $ | 243 |
| | $ | 758 |
| | $ | 1,263 |
|
Warranty reserve acquired from ANTONE | 25 |
| | — |
| | — |
|
Specific pre-acquisition ANTONE product warranty in excess of acquired limit | 303 |
| | — |
| | — |
|
Warranty reserve held-for-sale transferred with sale of CNS | — |
| | (194 | ) | | — |
|
Warranty expense (reversal) | (45 | ) | | (89 | ) | | (223 | ) |
Utilization | (374 | ) | | (232 | ) | | (282 | ) |
Total product warranty reserve at the end of the period | $ | 152 |
| | $ | 243 |
| | $ | 758 |
|
Note 7. Capital Stock and Stock Restriction Agreements:
Capital Stock Activity
The Board of Directors has the authority to issue up to 1,000,000 shares of preferred stock in one or more series and to fix the rights, preferences, privileges and restrictions thereof, including dividend rights, conversion rights, voting rights, terms of redemption, liquidation preferences, sinking fund terms and the number of shares constituting any series or the designation of such series, without any further vote or action by stockholders.
Share Repurchase Programs
In February 2010, the Board of Directors authorized a share repurchase program (the “February 2010 authorization”) allowing a repurchase of up to an aggregate of $10.0 million of its outstanding Class A Common Shares. During fiscal year 2011, 356,064 shares were repurchased under this program at weighted-average per share price of $1.56. The February 2010 authorization was fully utilized as of November 2011.
In August 2011, the Board of Directors authorized an additional share repurchase program whereby the Company may repurchase up to an aggregate of $20.0 million of its outstanding Class A Common Stock (the “August 2011 authorization”). During fiscal year 2012, under the February 2010 authorization and the August 2011 authorization, 6.4 million shares were repurchased with a weighted-average per share purchase price of $2.63. Repurchases include a purchase on May 31, 2011, of 1,000,000 shares of its Class A Common Stock, including 618,664 shares that were converted from the Company's Class B Common Stock. These shares were purchased from a voting trust dated February 23, 1994, (the “Voting Trust”) and from other trusts associated with certain members of Mr. Robert C. Penny III’s family. Robert C. Penny III and Robert W. Foskett currently are members of the Company’s Board of Directors. Mr. Foskett is Mr. Penny's nephew. Messrs. Penny and Foskett also serve as co-trustees and are beneficiaries of the Voting Trust. The Company paid a total of $3.4 million or approximately $3.43 per share, which represented the weighted-average price of the Company's Class A Common Stock for the three daily trading sessions on May 23, 24, and 25, 2011, as reported on the NASDAQ Global Select Market.
In fiscal year 2013, the Company repurchased 5.7 million shares under the August 2011 authorization with a weighted-average per share purchase price of $2.20. As of March 31, 2013, there was approximately $0.1 million remaining for additional share repurchases under the August 2011 authorization.
Additionally, in fiscal year 2013 and 2012, the Company repurchased 133,816 shares and 113,734 shares, respectively, from certain executives that were surrendered to satisfy the minimum statutory tax withholding obligations on the vesting of restricted stock units and performance-based restricted stock units. These repurchases are not included in the authorized share repurchase programs and had a weighted-average purchase price of $2.32 and $3.52, respectively.
Stock Restriction Agreements
The members of the Penny family (principal stockholders) have a Stock Transfer Restriction Agreement which prohibits, with limited exceptions, such members from transferring their Class B Common Stock acquired prior to November 30, 1995, without first offering such stock to the other members of the Penny family. If converted, Class B stock converts on a one-for-one basis into shares of Class A Common Stock upon a transfer. As of March 31, 2013, a total of 13,937,150 shares of Class B Common Stock are subject to this Stock Transfer Restriction Agreement.
Voting Rights
The Company’s Common Stock is divided into two classes. Class A Common Stock is entitled to one vote per share while Class B Common Stock is entitled to four votes per share. As of May 14, 2013, as trustees the Voting Trust, containing common stock held for the benefit of the Penny family, Robert C. Penny III and Robert W. Foskett have the exclusive power to vote over 51.4% of the votes entitled to be cast by the holders of our common stock. Certain Penny family members also own, or are beneficiaries of trusts that own shares outside of the Voting Trust. As trustees of the Voting Trust and other trusts, Messrs. Penny and Foskett control 55.4% of the voting power of the Company’s outstanding stock and therefore effectively control the Company.
Shares Issued and Outstanding
The following table summarizes Common Stock transactions for fiscal years 2011, 2012 and 2013:
|
| | | | | | | | |
| Common Shares Outstanding | | |
(in thousands) | Class A | | Class B | | Treasury |
Balance, March 31, 2010 | 52,762 |
| | 14,694 |
| | (4,273 | ) |
Options exercised | 1,540 |
| | — |
| | — |
|
Class B converted to Class A | 138 |
| | (138 | ) | | — |
|
Purchase of Treasury Stock | (356 | ) | | — |
| | (356 | ) |
Restricted stock grants, net of forfeitures | 90 |
| | — |
| | — |
|
Total shares outstanding, March 31, 2011 | 54,174 |
| | 14,556 |
| | (4,629 | ) |
Options exercised | 912 |
| | — |
| | — |
|
Class B converted to Class A | 619 |
| | (619 | ) | | — |
|
Purchase of Treasury Stock | (6,552 | ) | | — |
| | (6,552 | ) |
Restricted stock grants, including conversion of certain RSUs and PSUs, net of forfeitures | 1,276 |
| | — |
| | — |
|
Total shares outstanding, March 31, 2012 | 50,429 |
| | 13,937 |
| | (11,181 | ) |
Options exercised | 158 |
| | — |
| | — |
|
Class B converted to Class A | — |
| | — |
| | — |
|
Purchase of Treasury Stock | (5,788 | ) | | — |
| | (5,788 | ) |
Restricted stock grants, including conversion of certain RSUs and PSUs, net of forfeitures | 171 |
| | — |
| | — |
|
Total shares outstanding, March 31, 2013 | 44,970 |
| | 13,937 |
| | (16,969 | ) |
Note 8. Stock-based Compensation:
Employee Stock Incentive Plans
In September 2010, stockholders approved the amendment and restatement of the Westell Technologies, Inc. 2004 Stock Incentive Plan (the “2004 SIP Plan”) that permits the issuance of restricted Class A Common Stock, nonqualified stock options, incentive stock options, stock appreciation rights, restricted stock units and performance stock units share awards to selected officers, employees, and non-employee directors of the Company. There are a total of 4,824,090 shares available for issuance under this plan as of March 31, 2013.
Stock-Based Compensation Expense
Total stock-based compensation, excluding the impact of discontinued operations, is reflected in the Consolidated Statements of Operations as follows: |
| | | | | | | | | | | |
| Fiscal Year Ended March 31, |
(in thousands) | 2013 | | 2012 | | 2011 |
Cost of goods sold | $ | 27 |
| | $ | 55 |
| | $ | 50 |
|
Sales and marketing | 190 |
| | 173 |
| | 273 |
|
Research and development | 115 |
| | 58 |
| | 95 |
|
General and administrative | 1,075 |
| | 915 |
| | 463 |
|
Stock-based compensation expense | 1,407 |
| | 1,201 |
| | 881 |
|
Income tax benefit | — |
| | (61 | ) | | — |
|
Total stock-based compensation expense after taxes | $ | 1,407 |
| | $ | 1,140 |
| | $ | 881 |
|
Stock Options
Stock options that have been granted by the Company have an exercise price that is equal to the reported value of the Company’s stock on the grant date. Options usually vest annually from the date of grant over a period of 4 years. The Company’s options have a contractual term of 7 or 10 years. Compensation expense is recognized ratably over the vesting period. Certain options provide for accelerated vesting if there is a change in control (as defined in the 2004 SIP Plan) or when provided within individual employment contracts.
The Company uses the Black-Scholes model to estimate the fair value of employee stock options on the date of grant. That model employs parameters for which the Company has made estimates according to the assumptions noted below. Expected volatilities were based on historical volatilities of the Company’s stock. The expected option lives were derived from the output of the options valuation model and represent the period of time that options granted are expected to be outstanding based on historical trends. The risk-free interest rates were based on the United States Treasury yield curve for the same term as the expected term in effect at the time of grant. The dividend yield was based on expected dividends at the time of grant, which has always been zero.
The Company recorded expense of $0.2 million, $0.3 million, and $0.4 million in the twelve months ended March 31, 2013, 2012 and 2011, respectively, related to stock options. The Company received proceeds from the exercise of stock options of $0.1 million, $1.7 million, and $2.6 million in fiscal years 2013, 2012 and 2011, respectively. The total intrinsic value of options exercised during the years ended March 31, 2013, 2012 and 2011 was $0.2 million, $1.3 million, and $0.9 million, respectively.
Option activity for the twelve months ended March 31, 2013 is as follows:
|
| | | | | | | | | | | | |
| Shares | | Weighted- Average Exercise Price Per Share | | Weighted- Average Remaining Contractual Term (in years) | | Aggregate Intrinsic Value(a) (in thousands) |
Outstanding on March 31, 2012 | 2,254,103 |
| | $ | 2.04 |
| | 3.3 | | $ | 1,483 |
|
Granted | 340,000 |
| | $ | 2.15 |
| | | | |
Exercised | (157,807 | ) | | $ | 0.55 |
| | | | |
Forfeited | (80,440 | ) | | $ | 2.06 |
| | | | |
Expired | (241,410 | ) | | $ | 2.90 |
| | | | |
Outstanding on March 31, 2013 | 2,114,446 |
| | $ | 2.07 |
| | 2.8 | | $ | 868 |
|
Vested or expected to vest as of March 31, 2013 | 2,089,420 |
| | $ | 2.07 |
| | 2.8 | | $ | 867 |
|
Exercisable on March 31, 2013 | 1,650,683 |
| | $ | 2.15 |
| | 2.2 | | $ | 726 |
|
(a) The intrinsic value for the stock options is calculated based on the difference between the exercise price of the underlying awards and the average of the high and low Westell Technologies’ stock price as of the reporting date.
As of March 31, 2013, there was $0.2 million of pre-tax stock option compensation expense related to non-vested awards not yet recognized, including estimated forfeitures, which is expected to be recognized over a weighted-average period of 2.7 years.
The fair value of each option was estimated on the date of grant using the Black-Scholes option pricing model with the following weighted-average assumptions: |
| | | | | | | | | | | |
| Fiscal Year Ended March 31 |
| 2013 | | 2012 | | 2011 |
Input assumptions: | | | | | |
Expected volatility | 49 | % | | 70 | % | | 71 | % |
Risk-free interest rate | 0.7 | % | | 1.4 | % | | 1.6 | % |
Expected life | 5 years |
| | 5 years |
| | 5 years |
|
Expected dividend yield | — | % | | — | % | | — | % |
Output weighted-average grant-date fair value | $ | 0.89 |
| | $ | 1.93 |
| | $ | 1.12 |
|
The Company issues new shares of stock when stock options are exercised.
Restricted Stock
Vesting of restricted stock is subject to continued employment with the Company. During fiscal years 2013, 2012 and 2011, non-employee directors received grants of 70,000, 70,000 and 90,000 shares, respectively, that each vest annually over 4 years.
The Company recognizes compensation expense on a straight-line basis over the vesting periods of the awards based on the market value of Westell Technologies stock on the date of grant adjusted for estimated forfeitures.
The following table sets forth restricted stock activity for the twelve months ended March 31, 2013: |
| | | | | | |
| Shares | | Weighted-Average Grant Date Fair Value |
Non-vested as of March 31, 2012 | 1,045,000 |
| | $ | 1.54 |
|
Granted | 70,000 |
| | $ | 2.36 |
|
Vested | (352,500 | ) | | $ | 1.49 |
|
Forfeited | (24,000 | ) | | $ | 1.43 |
|
Non-vested as of March 31, 2013 | 738,500 |
| | $ | 1.65 |
|
The Company recorded $0.6 million, $0.5 million, and $0.1 million of expense in the twelve months ended March 31, 2013, 2012 and 2011, respectively, related to restricted stock. As of March 31, 2013, there was $0.7 million of pre-tax unrecognized compensation expense, including estimated forfeitures, related to non-vested restricted stock, which is expected to be recognized over a weighted-average period of 1.6 years.
Restricted Stock Units (“RSUs”) and Performance-based RSUs ("PSUs")
In fiscal years 2013 and 2012, 530,000 and 500,000 shares, respectively, of RSUs were awarded to certain key employees. These awards convert into shares of Class A Common Stock on a one-for-one basis upon vesting and vest in equal annual installments over 4 years from the grant dates.
In fiscal year 2011, certain executives were granted 620,000 RSUs with time-based vesting conditions, which converted into shares of Class A Common Stock during the first quarter of fiscal year 2012. Of these units, 25% vested on April 1, 2011, and the remaining shares vest 25% annually each April 1 thereafter. In addition, executives received 620,000 PSUs which converted to shares of restricted Class A Common Stock at the maximum rate of 140% during the first quarter of fiscal year 2012. The conversion rate was based upon fiscal year 2011 achievement against a return on assets ("ROA") metric. The actual conversion rate was 140%. On May 18, 2011, the first 25% of the PSUs vested and the remaining awards are scheduled to vest 25% annually on each subsequent April 1.
The Company recorded stock-based compensation expense of $0.6 million, $0.3 million and $0.4 million for RSUs and PSUs in fiscal years 2013, 2012 and 2011, respectively. As of March 31, 2013, there was approximately $1.8 million of pre-tax unrecognized compensation expense, including estimated forfeitures, related to the RSUs, which is expected to be recognized over a weighted-average period of 2.6 years.
The following table sets forth the RSUs activity for the twelve months ended March 31, 2013:
|
| | | | | | |
| Shares | | Weighted-Average Grant Date Fair Value |
Non-vested as of March 31, 2012 | 500,000 |
| | $ | 3.25 |
|
Granted | 530,000 |
| | $ | 2.25 |
|
Vested | (125,000 | ) | | $ | 3.25 |
|
Forfeited | (30,000 | ) | | $ | 2.36 |
|
Non-vested as of March 31, 2013 | 875,000 |
| | $ | 2.68 |
|
Non-qualified Non-public Discontinued Subsidiary Stock Options
The Company’s ConferencePlus subsidiary had a stock option plan for the purchase of ConferencePlus stock. There were no options granted since fiscal year 2009. As a result of the sale of ConferencePlus, during the third quarter of fiscal year 2012, the Company purchased all outstanding ConferencePlus options with a fair market value above strike price. The purchase price for each option was equal to the difference between the fair market value of a share of ConferencePlus stock and the strike price for each option, resulting in an aggregate purchase price of $117,000 for the options. All remaining outstanding options were forfeited.
During fiscal year 2011, the Company initiated a cash tender offer for certain ConferencePlus employee stock options. Pursuant to the tender offer, employees tendered for purchase 732,191 options, and the Company accepted for purchase all such options. As a result, the Company paid an aggregate of $36,000 to the participating employees and incurred equity-based compensation expense of $63,000 related to the remaining unamortized equity-based compensation expense associated with the options tendered in the offer and to any amounts paid in excess of fair value. As of March 31, 2011, the Company had fully recognized the expense related to these outstanding options.
Note 9. Note Payable Guarantee:
In fiscal year 2005, the Company sold its Data Station Termination product lines and specified fixed assets to Enginuity Communications Corporation (“Enginuity”). The Company provided an unconditional guarantee relating to a 10-year term note payable by Enginuity to a third-party lender that financed the transaction (the “Enginuity Note”). The Enginuity Note had an unpaid balance of $0.3 million and $0.5 million as of March 31, 2013, and 2012, respectively. Certain owners of Enginuity personally guaranteed the note and pledged assets as collateral. These personal guarantees will stay in place until the note is paid in full, as will the Company’s. Under the Company’s guarantee, the Company must pay all amounts due under the note payable upon demand from the lender; however, the Company would have recourse against the assets of Enginuity, the personal guarantees, and pledged assets.
The Company evaluated ASC 810 and concluded that Enginuity is a VIE as a result of the debt guarantee. The Company is not considered the primary beneficiary of the VIE and consolidation therefore is not required. At the time of the product sale, the Company assessed its obligation under this guarantee pursuant to the provisions of FIN 45, Guarantor's Accounting and Disclosure Requirements for Guarantees, Including Indirect Guarantees of Indebtedness of Others, as codified in ASC topic 460: Guarantees (“ASC 460”), and recorded a $0.3 million liability for the value of the guarantee. The Company evaluates the fair value of the liability based on Enginuity’s operating performance and the current status of the guaranteed debt obligation and determined no liability is needed as of March 31, 2013. The balance of the liability was $25,000 as of March 31, 2012. The liability is classified as a current liability in accrued expenses on the March 31, 2012, Consolidated Balance Sheet.
Note 10. Segment and Related Information:
Segment information is presented in accordance with a “management approach,” which designates the internal reporting used by the chief operating decision-maker for making decisions and assessing performance as the source of the Company's reportable segments. The Company’s two reportable segments are as follows:
Westell: The Company’s Westell product family consists of indoor and outdoor cabinets, enclosures and mountings; power distribution products; network interface devices for TDM/SONET networks and service demarcation; span powering equipment; remote monitoring devices; copper/fiber connectivity panels; managed Ethernet switches for utility and industrial networks; Ethernet extension devices for providing native Ethernet service handoff in carrier applications; wireless signal conditioning and monitoring products for cellular networks; tower-mounted amplifiers; cell site antenna-sharing products for cell site optimization; and custom systems integration services. Legacy products are sold primarily into wireline markets, but the Company also is actively moving to develop revenues from wireless telecommunications products. In the quarter ended September 30, 2012, the Company completed the relocation of the production of power distribution and remote monitoring products, which were manufactured at the Company’s Noran Tel subsidiary located in Regina, Saskatchewan, Canada, to its location in Aurora, Illinois. The remaining operations in Regina, Canada, are focused on power distribution product development and on sales of Westell products in Canada.
CNS: The Company’s CNS family of broadband products enables high-speed routing and networking of voice, data, video, and other advanced services in the home. The products allow service providers to deliver services, content, and applications over existing copper, fiber, coax, and wireless infrastructures. CNS products are typically installed in consumer residences or small businesses as a key component of broadband service packages. During the quarter ended June 30, 2011, the Company completed the CNS asset sale. The Company retained a major CNS customer relationship and contract. The Company completed the remaining contracted product shipments under this contract in December 2011. During the first three quarters of fiscal year 2013, the Company continued to provide warranty services under its contractual obligations and to sell ancillary products and software on a project basis to the retained customer. The Company expects no CNS activity with that retained customer going forward. The Company also retained the Homecloud product development program. The Homecloud product family aims to provide a new suite of services into the home, with an initial focus on media and information management, sharing and delivery, and with prospective functionality applicable to enhanced security, home control, and network management. The Company is actively marketing the Homecloud technology for sale and expects limited CNS expense in fiscal year 2014.
The ConferencePlus segment was sold in fiscal year 2012. It is reported as discontinued operations and therefore excluded from current segment reporting.
Management evaluates performance of these segments primarily by utilizing revenue and segment operating income (loss). The accounting policies of the segments are the same as those for Westell Technologies, Inc. described in the summary of significant accounting policies. The Company defines segment operating income (loss) as gross profit less expenses, including direct expenses from research and development expenses, sales and marketing expenses, and general and administrative (“G&A”) expenses. In fiscal years 2012 and 2011, certain operating expenses were allocated between the Westell and CNS segments, including rent, information technology costs, and accounting. The Westell segment was allocated 72% and 38% of these resource costs and the CNS segment was allocated 28% and 62% of the costs in fiscal years 2012 and 2011, respectively. No allocations were done in fiscal 2013 and the Westell segment carried all costs. Segment operating income (loss) excludes certain unallocated G&A costs. Unallocated costs include a portion of executive costs plus costs for corporate development, corporate governance, compliance and unutilized office space. When combined with the operating segments and after elimination of intersegment expenses, these costs total to the amounts reported in the Consolidated Financial Statements.
Segment information for the fiscal years ended March 31, 2013, 2012 and 2011, is set forth below:
|
| | | | | | | | | | | | | | | |
| Fiscal Year Ended March 31, 2013 |
(in thousands) | Westell | | CNS | | Unallocated | | Total |
Revenue | $ | 38,808 |
| | $ | 1,236 |
| | $ | — |
| | $ | 40,044 |
|
Gross profit | 13,325 |
| | 999 |
| | — |
| | 14,324 |
|
Gross margin | 34.3 | % | | 80.8 | % | | — |
| | 35.8 | % |
Operating expenses: | | | | | | | |
Sales & marketing | 7,492 |
| | (53 | ) | | — |
| | 7,439 |
|
Research & development | 5,725 |
| | 1,601 |
| | — |
| | 7,326 |
|
General & administrative | 4,401 |
| | 600 |
| | 4,909 |
| | 9,910 |
|
Intangible amortization | 887 |
| | 5 |
| | — |
| | 892 |
|
Restructuring | 149 |
| | — |
| | — |
| | 149 |
|
Goodwill impairment | 2,884 |
| | — |
| | — |
| | 2,884 |
|
Operating expenses | 21,538 |
|
| 2,153 |
| | 4,909 |
| | 28,600 |
|
Operating income (loss) | $ | (8,213 | ) | | $ | (1,154 | ) | | (4,909 | ) | | (14,276 | ) |
Other income (expense), net | | | | | 175 |
| | 175 |
|
Income tax (expense) benefit | | | | | (29,392 | ) | | (29,392 | ) |
Net income (loss) from continuing operations | | | | | $ | (34,126 | ) | | $ | (43,493 | ) |
| | | | | | | |
| Fiscal Year Ended March 31, 2012 |
(in thousands) | Westell | | CNS | | Unallocated | | Total |
Revenue | $ | 43,629 |
| | $ | 26,026 |
| | $ | — |
| | $ | 69,655 |
|
Gross profit | 17,272 |
| | 5,985 |
| | — |
| | 23,257 |
|
Gross margin | 39.6 | % | | 23.0 | % | | — |
| | 33.4 | % |
Operating expenses: | | | | | | | |
Sales & marketing | 5,573 |
| | 923 |
| | — |
| | 6,496 |
|
Research & development | 5,117 |
| | 2,610 |
| | — |
| | 7,727 |
|
General & administrative | 2,834 |
| | 976 |
| | 3,805 |
| | 7,615 |
|
Intangible amortization | 544 |
| | 4 |
| | — |
| | 548 |
|
Restructuring | 275 |
| | 275 |
| | — |
| | 550 |
|
Operating expenses | 14,343 |
| | 4,788 |
| | 3,805 |
| | 22,936 |
|
Operating income (loss) | $ | 2,929 |
| | $ | 1,197 |
| | (3,805 | ) | | 321 |
|
Gain on CNS asset sale | | | | | 31,654 |
| | 31,654 |
|
Other income (expense), net | | | | | 331 |
| | 331 |
|
Income tax (expense) benefit | | | | | (12,875 | ) | | (12,875 | ) |
Net income (loss) from continuing operations | | | | | $ | 15,305 |
| | $ | 19,431 |
|
|
| | | | | | | | | | | | | | | |
| Fiscal Year Ended March 31, 2011 |
(in thousands) | Westell | | CNS | | Unallocated | | Total |
Revenue | $ | 58,770 |
| | $ | 89,079 |
| | $ | — |
| | $ | 147,849 |
|
Gross profit | 25,667 |
| | 15,885 |
| | — |
| | 41,552 |
|
Gross margin | 43.7 | % | | 17.8 | % | | — |
| | 28.1 | % |
Operating expenses: | | | | | | | |
Sales & marketing | 5,922 |
| | 4,891 |
| | — |
| | 10,813 |
|
Research & development | 3,825 |
| | 7,949 |
| | — |
| | 11,774 |
|
General & administrative | 2,023 |
| | 3,365 |
| | 3,235 |
| | 8,623 |
|
Intangible amortization | 540 |
| | 5 |
| | — |
| | 545 |
|
Restructuring | — |
| | — |
| | — |
| | — |
|
Operating expenses | 12,310 |
| | 16,210 |
| | 3,235 |
| | 31,755 |
|
Operating income (loss) | $ | 13,357 |
| | $ | (325 | ) | | (3,235 | ) | | 9,797 |
|
Other income (expense), net | | | | | 20 |
| | 20 |
|
Income tax (expense) benefit | | | | | 53,304 |
| | 53,304 |
|
Net income (loss) from continuing operations | | | | | $ | 50,089 |
| | $ | 63,121 |
|
|
| | | | | | | | | | | |
Depreciation and amortization
| Fiscal Year Ended March 31, |
(in thousands) | 2013 | | 2012 | | 2011 |
Westell depreciation and amortization | $ | 1,342 |
| | $ | 955 |
| | $ | 809 |
|
CNS depreciation and amortization | 39 |
| | 121 |
| | 428 |
|
Total depreciation and amortization | $ | 1,381 |
| | $ | 1,076 |
| | $ | 1,237 |
|
The Westell and CNS segments use many of the same assets. The Company does not allocate assets between the Westell and CNS segments as such information is not used in measuring segment performance or allocating resources between segments. Therefore, total asset and capital expenditure information by each of these segments is not meaningful.
Enterprise-wide Information
More than 90% of the Company’s revenues were generated in the United States in fiscal years 2013, 2012 and 2011.
Significant Customers and Concentration of Credit
The Company is dependent on certain major companies operating in telecommunications markets that represent more than 10% of the total revenue. Sales to major customers and successor companies that exceed 10% of total revenue are as follows:
|
| | | | | | | | |
| Fiscal Year Ended March 31, |
| 2013 | | 2012 | | 2011 |
Verizon | 19.7 | % | | 45.4 | % | | 39.4 | % |
CenturyLink | 6.8 | % | | 6.0 | % | | 11.4 | % |
Frontier | 2.4 | % | | 3.1 | % | | 10.8 | % |
Telamon | 12.0 | % | | 8.9 | % | | 5.3 | % |
Time Warner Cable | 10.1 | % | | 2.0 | % | | 0.6 | % |
Major companies operating in telecommunications markets comprise a significant portion of the Company’s trade receivables. Receivables from major customers that exceed 10% of total accounts receivable balance are as follows:
|
| | | | | |
| Fiscal Year Ended March 31, |
| 2013 | | 2012 |
Verizon | 11.4 | % | | 22.4 | % |
Telamon | 12.6 | % | | 13.6 | % |
Time Warner Cable | 19.8 | % | | 14.8 | % |
Geographic Information
The Company’s financial information by geographic area was as follows for the fiscal years ended March 31:
|
| | | | | | | | | | | |
(in thousands) | Domestic | | International | | Total |
2013 | | | | | |
Revenue | $ | 38,069 |
| | $ | 1,975 |
| | $ | 40,044 |
|
Operating income (loss) | (13,410 | ) | | (866 | ) | | (14,276 | ) |
Total assets | 143,441 |
| | 1,731 |
| | 145,172 |
|
2012 | | | | | |
Revenue | $ | 63,974 |
| | $ | 5,681 |
| | $ | 69,655 |
|
Operating income (loss) | 798 |
| | (477 | ) | | 321 |
|
Total assets | 192,137 |
| | 5,289 |
| | 197,426 |
|
2011 | | | | | |
Revenue | $ | 140,848 |
| | $ | 7,001 |
| | $ | 147,849 |
|
Operating income (loss) | 9,491 |
| | 306 |
| | 9,797 |
|
Total assets | 192,457 |
| | 8,930 |
| | 201,387 |
|
International identifiable assets, revenues and operating income (loss) are related to Noran Tel, Inc. which is located in Regina, Saskatchewan, Canada. International identifiable assets for fiscal year 2011 also include the assets of Conference Plus Global Services, Ltd., which was located in Dublin, Ireland, and London, England. Conference Plus Global Services, Ltd. was sold on December 31, 2011, with ConferencePlus.
Note 11. Restructuring:
Noran Tel Restructuring
The Company recognized restructuring expense of $149,000 and $275,000 in fiscal year 2013 and 2012, respectively, in the Westell segment for personnel costs related to severance and other relocation costs for the Noran Tel relocation, described in Note 1. The relocation resulted in the termination of 35 employees located in Canada. The total cost of this action was $424,000. The relocation was completed during the quarter ended September 30, 2012. As of March 31, 2013, and 2012, $418,000 and $0 of these costs had been paid leaving an unpaid balance of $6,000 and $275,000, respectively, which is presented on the Consolidated Balance Sheets within accrued compensation.
ConferencePlus Restructuring
In fiscal year 2012, in connection with the ConferencePlus sale, the Company recognized restructuring expense of $667,000 within discontinued operations for personnel costs related to severance agreements with two former ConferencePlus executives. This expense is presented within income from discontinued operations on the Consolidated Statement of Operations. The liability was retained by the Company. As of March 31, 2012, $329,000 was paid leaving an unpaid balance of $338,000 which is presented on the Consolidated Balance Sheets within accrued compensation. The entire March 31, 2012, balance was paid during fiscal year 2013.
CNS Asset Sale Restructuring
In the first quarter of fiscal year 2012, as a result of the CNS asset sale, the Company initiated a cost reduction action that resulted in the termination of 12 employees in the CNS segment. The total cost of this restructuring action was approximately $397,000, offset by $122,000 which was reimbursed by NETGEAR. As of March 31, 2012, all of these costs had been paid.
Total fiscal year 2013 restructuring charges and their utilization are summarized as follows: |
| | | | | | | | | | | |
(in thousands) | Employee -related | | Other costs | | Total |
Liability at March 31, 2012 | $ | 561 |
| | $ | 52 |
| | $ | 613 |
|
Charged | 89 |
| | 60 |
| | 149 |
|
Payments | (644 | ) | | (112 | ) | | (756 | ) |
Liability at March 31, 2013 | $ | 6 |
| | $ | — |
| | $ | 6 |
|
Total fiscal year 2012 restructuring charges and their utilization are summarized as follows:
|
| | | | | | | | | | | |
(in thousands) | Employee -related | | Other costs | | Total |
Liability at March 31, 2011 | $ | — |
| | $ | — |
| | $ | — |
|
Charged to continuing operations | 498 |
| | 52 |
| | 550 |
|
Charged to discontinued operations | 667 |
| | — |
| | 667 |
|
Payments | (604 | ) | | — |
| | (604 | ) |
Liability at March 31, 2012 | $ | 561 |
| | $ | 52 |
| | $ | 613 |
|
There were no restructuring expenses in fiscal year 2011.
Note 12. Short-term Investments:
The following table presents short-term investments as of March 31, 2013, and 2012:
|
| | | | | | | |
(in thousands) | March 31, 2013 | | March 31, 2012 |
Certificates of deposit | $ | 3,682 |
| | $ | 6,061 |
|
Held-to-maturity, pre-refunded municipal bonds | 20,667 |
| | 8,394 |
|
Total investments | $ | 24,349 |
| | $ | 14,455 |
|
The fair value of short-term investments approximates their carrying amounts due to the short-term nature of these financial assets.
Note 13. Fair Value Measurements:
Fair value is defined by ASC 820 as the exchange price that would be received for an asset or paid to transfer a liability (an exit price) in the principal or most advantageous market for the asset or liability in an orderly transaction between market participants on the measurement date. ASC 820 establishes a three-level fair value hierarchy that prioritizes the inputs used to measure fair value. The hierarchy requires entities to maximize the use of observable inputs and minimize the use of unobservable inputs. The three levels of inputs, of which the first two are considered observable and the last unobservable, used to measure fair value are as follows:
| |
• | Level 1 – Quoted prices in active markets for identical assets and liabilities. |
| |
• | Level 2 – Quoted prices in active markets for similar assets and liabilities, or other inputs that are observable for the asset or liability, either directly or indirectly, for substantially the full term of the financial instrument. |
| |
• | Level 3 – Unobservable inputs that are supported by little or no market activity and that are significant to the fair value of the assets and liabilities. This includes certain pricing models, discounted cash flow methodologies and similar techniques that use significant unobservable inputs. |
The Company’s money market funds are measured using Level 1 inputs. In fiscal year 2013, the ANTONE contingent consideration payable described in Note 1 and in fiscal year 2012, the note payable guarantee described in Note 9 are measured using Level 3 inputs.
The following table presents financial assets and non-financial liabilities measured at fair value on a recurring basis and their related valuation inputs as of March 31, 2013:
|
| | | | | | | | | | | | | | | | |
(in thousands) | Total Fair Value of Asset or Liability | | Quoted Prices in Active Markets for Identical Assets (Level 1) | | Significant Other Observable Inputs (Level 2) | | Significant Unobservable Inputs (Level 3) | | Balance Sheet Classification |
Assets: | | | | | | | | | |
Money market funds | $ | 52,849 |
| | $ | 52,849 |
| | — |
| | — |
| | Cash and cash equivalents |
Liabilities: | | | | | | | | | |
Contingent consideration, long-term | $ | 2,333 |
| | — |
| | — |
| | $ | 2,333 |
| | Contingent consideration payable |
The following table presents financial assets, excluding cash, and non-financial liabilities measured at fair value on a recurring basis and their related valuation inputs as of March 31, 2012:
|
| | | | | | | | | | | | | | | | |
(in thousands) | Total Fair Value of Asset or Liability | | Quoted Prices in Active Markets for Identical Assets (Level 1) | | Significant Other Observable Inputs (Level 2) | | Significant Unobservable Inputs (Level 3) | | Balance Sheet Classification |
Assets: | | | | | | | | | |
Money market funds | $ | 82,931 |
| | $ | 82,931 |
| | — |
| | — |
| | Cash and cash equivalents |
Liabilities: | | | | | | | | | |
Guarantee | $ | 25 |
| | — |
| | — |
| | $ | 25 |
| | Accrued expenses |
In connection with the ANTONE acquisition in the quarter ended June 30, 2012, payment of a portion of the purchase price is contingent upon the profitability of the acquired products for post-closing periods through June 30, 2016, and may be offset by working capital adjustments and certain indemnification claims. The Company estimates the fair value of contingent consideration as the present value of the expected payments over the term of the arrangement based on financial forecasts of future profitability of the acquired products and reaching the forecast. This estimate is subject to ongoing evaluation.
The fair value measurement of contingent consideration as of March 31, 2013, encompasses the following significant unobservable inputs: |
| | | |
($ in thousands) | Unobservable Inputs |
Estimated earn-out contingent consideration | $ | 3,500 |
|
Working capital and other adjustment | $ | (444 | ) |
Indemnification related to warranty claims | $ | (303 | ) |
Discount rate | 7.5 | % |
Approximate timing of cash flows | 3 years |
|
The following table summarizes contingent consideration activity: |
| | | |
($ in thousands) | |
Balance as of March 31, 2012 | $ | — |
|
Contingent consideration from business acquisition | 3,038 |
|
Contingent consideration – payments | — |
|
Contingent consideration – change in fair value (included in G&A expense) | 42 |
|
Working capital and other adjustment | (444 | ) |
Indemnification related to warranty claims | (303 | ) |
Balance as of March 31, 2013 | $ | 2,333 |
|
Note 14. Quarterly Results of Operations (Unaudited):
The following tables present certain financial information for each of the last eight fiscal quarters. The Company believes that the unaudited information regarding each of these quarters is prepared on the same basis as the audited Consolidated Financial Statements of the Company appearing elsewhere in this Form 10-K. In the opinion of management, all necessary adjustments (consisting only of normal recurring adjustments) have been included to present fairly the unaudited quarterly results when read in conjunction with the audited Consolidated Financial Statements of the Company and the Notes thereto appearing elsewhere in this Form 10-K. These quarterly results of operations are not necessarily indicative of the results for any future period. Previously reported quarterly amounts have been adjusted for the effects of the discontinued operations described in Note 1.
The quarterly fluctuations in revenue and gross profit in fiscal year 2012 are due primarily to fluctuations in the CNS segment. The Company sold substantially all of the assets of CNS in April, 2011. The Company retained a certain major CNS customer relationship and contract. The Company completed the remaining contractually required product shipments under the retained contract in December 2011. The fiscal third quarter ending December 31 contains seasonality effects in the Westell segment. The Westell segment sells equipment that is installed outdoors and the ordering of such equipment declines during and in advance of the colder months. Budget cycles for our customers may also contribute to revenue variability in those same
periods. The third quarter of fiscal year 2012 reflected exaggerated declines in customer purchases from the Westell segment as a result of a variety of factors.
|
| | | | | | | | | | | | | | | |
| Fiscal Year 2013 Quarter Ended |
| June 30, 2012 | | Sept. 30, 2012 | | Dec. 31, 2012 | | Mar. 31, 2013 |
(in thousands, except per share amounts) | | | | | | | |
Revenue | $ | 10,530 |
| | $ | 9,922 |
| | $ | 8,928 |
| | $ | 10,664 |
|
Gross profit | 3,796 |
| | 3,448 |
| | 3,143 |
| | 3,937 |
|
Goodwill impairment | — |
| | — |
| | — |
| | 2,884 |
|
Total operating expenses | 6,593 |
| | 6,689 |
| | 5,921 |
| | 9,397 |
|
Income (loss) before income taxes and discontinued operations | (2,713 | ) | | (3,234 | ) | | (2,735 | ) | | (5,419 | ) |
Income tax (expense) benefit | 973 |
| | 1,059 |
| | 1,399 |
| | (32,823 | ) |
Net income (loss) from continuing operations | (1,740 | ) | | (2,175 | ) | | (1,336 | ) | | (38,242 | ) |
Income (loss) from discontinued operations, net of tax | — |
| | — |
| | (629 | ) | | 84 |
|
Net income (loss) | (1,740 | ) | | (2,175 | ) | | (1,965 | ) | | (38,158 | ) |
Net income (loss) per common share: | | | | | | | |
Basic | $ | (0.03 | ) | | $ | (0.04 | ) | | $ | (0.03 | ) | | $ | (0.66 | ) |
Diluted | $ | (0.03 | ) | | $ | (0.04 | ) | | $ | (0.03 | ) | | $ | (0.66 | ) |
Operating expenses in fiscal year 2013 included the following items: the June 30, 2012, quarter included $545,000 of excess and obsolete inventory expense; the September quarter included $534,000 of expense for the costs of a resolution of a dispute related the CNS sale and expenses resulting from the acquisition of ANTONE; the March quarter included a $2.9 million goodwill impairment charge.
Discontinued operations in the third quarter of fiscal year 2013 includes an after-tax charge of $0.9 million for a pending indemnification claim related to the sale of the discontinued operations of ConferencePlus and an unrelated tax benefit of $0.3 million that resulted from finalizing income tax filings related to the sale.
The fourth quarter of fiscal year 2013 includes an income tax charge for fully reserving deferred tax assets.
|
| | | | | | | | | | | | | | | |
| Fiscal Year 2012 Quarter Ended |
| June 30, 2011 | | Sept. 30, 2011 | | Dec. 31, 2011 | | Mar. 31, 2012 |
(in thousands, except per share amounts) | | | | | | | |
Revenue | $ | 23,201 |
| | $ | 20,728 |
| | $ | 14,392 |
| | $ | 11,334 |
|
Gross profit | 8,366 |
| | 6,221 |
| | 4,263 |
| | 4,407 |
|
Total operating expenses | 6,613 |
| | 5,621 |
| | 5,052 |
| | 5,650 |
|
Gain on CNS asset sale | 31,608 |
| | 46 |
| | — |
| | — |
|
Income (loss) before income taxes and discontinued operations | 33,379 |
| | 760 |
| | (720 | ) | | (1,113 | ) |
Income tax (expense) benefit | (13,228 | ) | | 1,810 |
| | 268 |
| | (1,725 | ) |
Net income (loss) from continuing operations | 20,151 |
| | 2,570 |
| | (452 | ) | | (2,838 | ) |
Income from discontinued operations, net of tax | 980 |
| | 927 |
| | 20,254 |
| | 390 |
|
Net income (loss) | 21,131 |
| | 3,497 |
| | 19,802 |
| | (2,448 | ) |
Net income (loss) per common share: | | | | | | | |
Basic | $ | 0.31 |
| | $ | 0.05 |
| | $ | 0.30 |
| | $ | (0.04 | ) |
Diluted | $ | 0.30 |
| | $ | 0.05 |
| | $ | 0.29 |
| | $ | (0.04 | ) |
Operating expenses in fiscal year 2012 included the following items: the June 30, 2011, quarter included $0.2 million of severance benefits for employee terminations related to the sale of CNS; the March 31, 2012, quarter included a $0.3 million restructuring charge consisting primarily of severance benefits for employee terminations related to the plan to relocate the majority of Noran Tel operations from Canada to the United States.
Note 15. Subsequent Event:
Acquisition of Kentrox Subsequent to Year-End
On April 1, 2013, the Company's wholly-owned subsidiary, Westell, Inc. acquired 100% of the Kentrox, Inc. ("Kentrox") stock for $30.0 million cash pursuant to an agreement dated March 15, 2013, subject to an adjustment for working capital and escrow provisions. Kentrox is a worldwide leader in intelligent site management solutions, providing comprehensive monitoring, management and control of any site. The machine-to-machine communications Kentrox provides enable service providers, tower operators, and other network operators to reduce operating costs while improving network performance. Kentrox provides solutions to customers in North and South America, Australia, Africa, and Europe.
The Company incurred $0.3 million of related acquisition costs in fiscal year 2013 which are reflected in general and administrative costs in the Consolidated Statement of Operations. The Company expects to report Kentrox as a separate segment during fiscal year 2014. The acquisition qualifies as a business combination and will be accounted for using the acquisition method of accounting.
As a result of limited access to Kentrox information required to prepare initial accounting, together with the limited time since the acquisition date and the effort required to conform the financial statements to the Company's practices and policies, the initial accounting for the business combination is incomplete at the time of this filing. As a result, the Company is unable to provide the amounts recognized as of the Acquisition date for the major classes of assets acquired and liabilities assumed, pre-acquisition contingencies and goodwill. Also, the Company is unable to provide pro forma revenues and earnings of the combined entity. This information will be included in the Company's Quarterly Report on Form 10-Q for the quarter ended June 30, 2013.
WESTELL TECHNOLOGIES, INC. AND SUBSIDIARIES
SCHEDULE II — VALUATION AND QUALIFYING ACCOUNTS
|
| | | | | | | | | | | | | | | | | | | |
(In thousands) | Balance at Beginning of Year | | Reduction from CNS asset sale and sale of ConferencePlus | | Net Additions Charged to Cost and Expenses | | Additions (Deductions) | | Balance at End of Year |
2013 | | | | | | | | | |
Accounts receivable allowances | $ | 12 |
| | $ | — |
| | $ | (2 | ) | | $ | — |
| | $ | 10 |
|
Reserve for excess and obsolete inventory and net realizable value | 1,479 |
| | — |
| | 1,090 |
| | (537 | ) | (1) | 2,032 |
|
Deferred tax assets valuation allowance | 2,253 |
| | — |
| | — |
| | 34,032 |
| (2) | 36,285 |
|
Reserve for returns | 13 |
| | — |
| | 218 |
| | (212 | ) | | 19 |
|
2012 | | | | | | | | | |
Accounts receivable allowances | $ | 147 |
| | (61 | ) | | $ | (79 | ) | | $ | 5 |
| (3) | $ | 12 |
|
Reserve for excess and obsolete inventory and net realizable value | 1,551 |
| | (57 | ) | | 816 |
| | (831 | ) | (1) | 1,479 |
|
Deferred tax assets valuation allowance | 527 |
| | — |
| | — |
| | 1,726 |
| (2) | 2,253 |
|
Reserve for returns | 7 |
| | — |
| | 98 |
| | (92 | ) | | 13 |
|
2011 | | | | | | | | | |
Accounts receivable allowances | $ | 237 |
| | — |
| | $ | (34 | ) | | $ | (56 | ) | (3) | $ | 147 |
|
Reserve for excess and obsolete inventory and net realizable value | 1,691 |
| | — |
| | 1,157 |
| | (1,297 | ) | (1) | 1,551 |
|
Deferred tax assets valuation allowance | 61,297 |
| | — |
| | — |
| | (60,770 | ) | (2) | 527 |
|
Reserve for returns | 15 |
| | — |
| | 94 |
| | (102 | ) |
| 7 |
|
| |
(1) | Inventory charged against inventory reserves. |
| |
(2) | Change in valuation allowance due to change in assessment of realizability of deferred tax assets. |
| |
(3) | Accounts written off, net of recoveries. |