UNITED STATES
SECURITIES AND EXCHANGE COMMISSION
Washington, D.C. 20549
FORM 10-K/A
Amendment No. 1
|
| |
x | Annual Report pursuant to Section 13 or 15(d) of the Securities Exchange Act of 1934 |
For the fiscal year ended March 31, 2015
or |
| |
¨ | Transition Report pursuant to Section 13 or 15(d) of the Securities Exchange Act of 1934 |
For the transition period from to .
Commission file number: 0-27266
WESTELL TECHNOLOGIES, INC.
(Exact name of registrant as specified in its charter)
|
| | |
Delaware | | 36-3154957 |
(State or other jurisdiction of incorporation or organization) | | (I.R.S. Employer Identification No.) |
750 North Commons Drive, Aurora, Illinois 60504
(Address of principal executive offices) (Zip Code)
Registrant’s telephone number, including area code: (630) 898-2500
|
| | |
Securities registered pursuant to Section 12(b) of the Act: | | Name of each exchange on which registered: |
Class A Common Stock, $.01 par value | | NASDAQ Global Select Market |
Securities registered pursuant to Section 12(g) of the Act: None
Indicate by check mark if the registrant is a well-known seasoned issuer, as defined in Rule 405 of the Act. Yes ¨ No x
Indicate by check mark if the registrant is not required to file reports pursuant to Section 13 or Section 15(d) of the Act. Yes ¨ No x
Indicate by check mark whether the registrant (1) has filed all reports required to be filed by Section 13 or 15(d) of the Securities Exchange Act of 1934 during the preceding 12 months (or for such shorter period that the registrant was required to file such reports), and (2) has been subject to such filing requirements for the past 90 days. Yes x No ¨
Indicate by check mark whether the registrant has submitted electronically and posted on its corporate Web site, if any, every Interactive Data File required to be submitted and posted pursuant to Rule 405 of Regulation S-T (§ 229.405 of this chapter) during the preceding 12 months (or for such shorter period that the registrant was required to submit and post such files). Yes x No ¨
Indicate by check mark if disclosure of delinquent filers pursuant to Item 405 of Regulation S-K (§229.405 of this chapter) is not contained herein, and will not be contained, to the best of registrant’s knowledge, in definitive proxy or information statements incorporated by reference in Part III of this Form 10-K or any amendment to this Form 10-K. ¨
Indicate by check mark whether the registrant is a large accelerated filer, an accelerated filer, a non-accelerated filer, or a smaller reporting company. See the definitions of “large accelerated filer,” “accelerated filer” and “smaller reporting company” in Rule 12b-2 of the Exchange Act. (Check One): |
| | | |
Large Accelerated Filer | ¨ | Accelerated Filer | x |
| | | |
Non-Accelerated Filer | ¨ (Do not check if a smaller reporting company), | Smaller Reporting Company | ¨ |
Indicate by check mark whether the registrant is a shell company (as defined in Rule 12b-2 of the Exchange Act). Yes ¨ No x
The estimated aggregate market value of voting and non-voting Class A Common Stock held by non-affiliates (within the meaning of the term under the applicable regulations of the Securities and Exchange Commission) as of September 30, 2014 (based upon an estimate that 66% of the shares are so owned by non-affiliates and upon the average of the high and low prices for the Class A Common Stock on the NASDAQ Global Select Market on that date) was approximately $79 million. Determination of stock ownership by non-affiliates was made solely for the purpose of responding to this requirement and registrant is not bound by this determination for any other purpose.
As of May 14, 2015, 46,892,935 shares of the registrant’s Class A Common Stock were outstanding and 13,937,151 shares of registrant’s Class B Common Stock (which automatically converts on a one-for-one basis into shares of Class A Common Stock upon a transfer of such stock except transfers to certain permitted transferees) were outstanding.
DOCUMENTS INCORPORATED BY REFERENCE
Portions of the registrant’s definitive proxy statement for the 2015 Annual Stockholders’ Meeting are incorporated by reference into Part III hereof.
EXPLANATORY NOTE
This Amendment No. 1 on Form 10-K/A ("Amendment No. 1") amends the Annual Report on Form 10-K of Westell Technologies, Inc. (the “Company”) for the fiscal year ended March 31, 2015, as originally filed with the Securities and Exchange Commission (the “SEC”) on May 22, 2015 (the “Original Filing”). This Amendment No. 1 amends the Original Filing to correct an error related to a previously unidentified pre-acquisition liability, as more fully described in Note 1 to the Consolidated Financial Statements contained in this Amendment No. 1. For ease of reference, this Amendment No. 1 amends and restates the Original Filing in its entirety. Revisions to the Original Filing have been made to the following sections:
| |
• | Item 6 - Selected Financial Data |
| |
• | Item 7 - Management’s Discussion and Analysis of Financial Condition and Results of Operations |
| |
• | Item 8 - Financial Statements and Supplementary Data |
| |
• | Item 9A - Controls and Proceedures |
| |
• | Exhibit 23.1 - Consent of Ernst & Young LLP |
In addition, the Company’s principal executive officer and principal financial officer have provided new certifications in connection with this Amendment No. 1 (Exhibits 31.1, 31.2, and 32.1).
Management assessed its evaluation of the effectiveness of the Company's internal control over financial reporting as of March 31, 2015 based on the framework established in Internal Control - Integrated Framework (2013) issued by the Committee of Sponsoring Organizations of the Treadway Commission. Management has concluded that the Company's internal control over financial reporting was effective as of March 31, 2015 in spite of the restatement required because the restatement was caused by a previously unidentified pre-acquisition liability. The Company's controls effectively detected this error at the first opportunity following the acquisition for the control to function.
Except as described above, no other amendments have been made to the Original Filing. This Amendment continues to speak as of the date of the Original Filing, and the Company has not updated the disclosure contained herein to reflect events that have occurred since the date of the Original Filing. Accordingly, this Amendment should be read in conjunction with the Company’s other filings made with the SEC subsequent to the filing of the Original Filing, including any amendments to those filings.
WESTELL TECHNOLOGIES, INC.
2015 ANNUAL REPORT ON FORM 10-K/A CONTENTS
|
| | |
| | Page |
Item | | |
1. | | |
1A. | | |
1B. | | |
2. | | |
3. | | |
4. | | |
| | |
| | |
5. | | |
6. | | |
7. | | |
7A. | | |
8. | | |
9. | | |
9A. | | |
9B. | | |
| | |
| | |
10. | | |
11. | | |
12. | | |
13. | | |
14. | | |
| | |
| | |
15. | | |
| | |
CAUTIONARY STATEMENT REGARDING FORWARD-LOOKING INFORMATION
Certain statements contained herein that are not historical facts or that contain the words “believe,” “expect,” “intend,” “anticipate,” “estimate,” “may,” “will,” “plan,” “should,” or derivatives thereof and other words of similar meaning are forward-looking statements that involve risks and uncertainties. Actual results may differ materially from those expressed in or implied by such forward-looking statements. Factors that could cause actual results to differ materially include, but are not limited to, product demand and market acceptance risks, customer spending patterns, need for financing and capital, economic weakness in the United States (U.S.) economy and telecommunications market, the effect of international economic conditions and trade, legal, social and economic risks (such as import, licensing and trade restrictions), the impact of competitive products or technologies, competitive pricing pressures, customer product selection decisions, product cost increases, component supply shortages, new product development, excess and obsolete inventory, commercialization and technological delays or difficulties (including delays or difficulties in developing, producing, testing and selling new products and technologies), the ability to successfully consolidate and rationalize operations, the ability to successfully identify, acquire and integrate acquisitions, effects of the Company’s accounting policies, retention of key personnel and other risks more fully described in this Form 10-K/A for the fiscal year ended March 31, 2015, under Item 1A—Risk Factors. The Company undertakes no obligation to publicly update these forward-looking statements to reflect current events or circumstances after the date hereof or to reflect the occurrence of unanticipated events or otherwise.
Trademarks
The following terms used in this filing are our trademarks: ClearLink®, Kentrox®, Optima Management System®,
UDIT®, WESTELL TECHNOLOGIES®, and Westell®. All other trademarks appearing in this filing are the property of their holders.
PART I
Overview
Westell Technologies, Inc., (the Company) is a leading provider of in-building wireless, intelligent site management, cell site optimization, and outside plant solutions focused on innovation and differentiation at the edge of telecommunication networks, where end users connect. The Company’s comprehensive set of products and solutions are designed to advance network performance for carriers, integrators, and other network operators, allowing them to reduce operating costs and improve network performance. With millions of products successfully deployed worldwide, the Company is a trusted partner for transforming networks into high performance, reliable systems.
The Company's two business segments, In-Building Wireless and Communication Solutions Group, are engaged in the design, development, assembly, and marketing of a wide variety of products and solutions. Segment financial information is set forth in the Notes to the Consolidated Financial Statements.
In-Building Wireless (IBW) Segment
The IBW segment solutions include distributed antenna systems (DAS) conditioners, high-performance digital repeaters and bi-directional amplifiers (BDAs), and system components and antennas, all used by wireless service providers and neutral-party hosts to fine tune radio frequency (RF) signals that helps extend coverage to areas not served well or at all by traditional cell sites.
Communication Solutions Group (CSG) Segment
The CSG segment solutions include intelligent site management (ISM), cell site optimization (CSO), and outside plant (OSP) as follows:
• ISM solutions include a suite of Remote monitoring and control devices which, when combined with the Company's Optima management system, provides comprehensive machine-to-machine (M2M) communications that enable operators to remotely monitor, manage, and control site infrastructure and support systems.
• CSO solutions consist of tower mounted amplifiers (TMAs), small outdoor-hardened units mounted next to antennas on cell towers, enabling wireless service providers to improve the overall performance of a cell site, including increasing data throughput and reducing dropped connections.
• OSP solutions, which are sold to wireline and wireless service providers as well as industrial network operators, consist of a broad range of offerings, including cabinets, enclosures, and mountings; synchronous optical networks/time
division multiplexing (SONET/TDM) network interface units; power distribution units; copper and fiber connectivity panels; hardened Ethernet switches; and systems integration services.
Industry Trends and Market Solutions
In-Building Wireless
In-building wireless solutions, including DAS and small cell installations, have increased dramatically in the last decade, driven by the trend for voice and data traffic to move from the outdoor macro environment to indoors. Current projections show that over 80% of all voice and data traffic is now handled from within buildings. This trend is likely to continue to grow as more people use mobile devices and data-intensive services in areas such as stadiums, universities, airports, and office buildings. As the number of systems and users continues to increase, the greater the demand for a reliable network that can manage the increased coverage and capacity requirements.
Our in-building wireless solutions, which include our internally-developed DAS conditioners and the comprehensive suite of products acquired with the addition of Cellular Specialties, Inc. (CSI) on March 1, 2014, provide wireless service providers with a broad set of solutions to help meet growing market demand. These solutions include:
•DAS conditioners: These units interconnect the wireless base transceiver system (BTS) to the DAS head-end while conditioning signals. Active systems can also monitor and control RF performance (e.g. the BTS power coming into the DAS). Both our passive and active devices can accommodate all of the major wireless service provider frequency bands, with numerous port configuration options. Our Universal DAS Interface Unit (UDIT), an active, remotely manageable, high density, space saving unit with advanced features like spectrum analysis and tone generators to help test and analyze signal measurement data has just recently been made available.
•High performance digital repeaters and bi-directional amplifiers (BDAs): These units provide a means to amplify and appropriately filter the RF signal from a cell site, providing the additional power and improved signal to noise performance necessary to optimize wireless service seamlessly throughout a building or structure.
•System components and antennas: We offer a variety of passive system components (couplers, dividers, and tappers) for use in DAS and in-building wireless systems to direct and condition energy flow for specific frequency bands. We also offer a broad line of antennas to support in-building wireless communication.
Our in-building wireless solutions improve network performance, provide real-time monitoring and management to reduce troubleshooting time, and minimize operating and capital costs.
Intelligent Site Management
Telecommunication service providers and cell tower operators were initially focused on network coverage. Priority then moved to network availability. With the migration to long-term evolution (LTE) and 4th generation (4G) networks, capacity is now a primary concern. With this shifting of requirements to managing faster speeds and higher capacity, more intelligence is moving to the network edge (e.g., cell sites and in-building systems). This has increased the importance of the edge support infrastructure such as environmental controls, power systems, and security.
Our ISM solutions, acquired with the addition of Kentrox on April 1, 2013, provide comprehensive M2M communication, enabling operators to remotely monitor, manage, and control critical infrastructure and ensure the continued health and success of the network. The four important areas of focus include:
•Environmental management: heating, ventilation, and air conditioning (HVAC) monitoring/energy monitoring/control, environmental monitoring, and aircraft warning light (AWL) management.
•Power management: AC and DC power monitoring, AWL management, battery monitoring, fuel monitoring, generator management, hybrid power management, rectifier monitoring, and tenant power monitoring.
•Security management: access management, asset tampering, and surveillance management.
•Communications management: microwave, DAS, and small cell management.
The comprehensive ISM solution features the Kentrox Remote suite of products and the Optima management system for a complete view and understanding of site assets remotely (i.e., without a site visit). This enables the ability to more cost-effectively monitor, troubleshoot, and correct problems with network infrastructure before service affecting outages occur.
Our ISM solutions reduce network operating costs; improve network performance, including quality, reliability, and availability; and improve site security.
Cell Site Optimization
The expansion of LTE and 4G mobile networks and the introduction of enhanced wireless services and devices are causing a greater demand for higher network throughput. At the same time, mobile users expect a quality experience every time they use a device, whether in a city or driving in remote areas. This is forcing wireless service providers to optimize their networks by optimizing the cell site coverage area and increasing RF data throughput. CSO is critical, and TMAs have become increasingly popular to enhance the RF signal performance and improve the end users quality of service, while using the existing network infrastructure.
We provide a comprehensive range of TMAs that enables wireless service providers to improve CSO by boosting the RF signal performance from mobile devices. Our single band and multi band TMAs provide one of the lowest noise figures in the industry, are a highly reliable and proven technology, and provide very low passive intermodulation distortion and bypass loss. In the unlikely event of a TMA failure, it automatically switches to bypass mode, ensuring network availability.
We also provide turnkey services solution for optimizing RF signal performance. From sourcing, configuration, engineering, project management, deployment, turn-up, training, to follow on support, wireless service providers can be ensured a quality and timely implementation to meet their requirements.
Our CSO solutions improve network quality and capacity, expand the coverage area, increase data throughput, and improve the end users wireless experience.
Outside Plant
Building a communications network that can sustain harsh environmental conditions while providing the required reliability to keep customers happy can be a challenge, especially while trying to minimize costs. Whether it’s an industrial, utility, transportation, or telecommunications network, the connections between devices must effectively, efficiently, and safely carry and process signals throughout the infrastructure (cables, racks, enclosures, power distribution, etc.) while providing remote management capabilities.
We provide a comprehensive range of outside plant solutions to connect nearly any outdoor building or facility, including:
•Power Distribution: Includes fuse panels and breaker panels for installation in equipment racks to connect up to bulk power circuits and distribute power to other equipment via individual power feeds.
•Copper/Fiber Connectivity: A flexible portfolio of standard relay rack mount panels and wall mount enclosures for Ethernet, fiber, or coax cables to facilitate easy and simple splicing, terminations, or handoffs.
•Ethernet Solutions: Includes industrial-hardened, multiport, remotely-managed Ethernet switches with a variety of port count and connectivity options (both fiber and copper), including models with advanced powering and site telemetry features.
•SONET/TDM Solutions: Includes network interface devices with performance monitoring features, line repeaters, and protection panels.
•Cabinets, Enclosures, and Mountings: Includes outdoor cabinets for sheltering equipment and maintaining proper operating temperature, enclosures for protecting equipment, and prewired mountings to accommodate plug-in cards.
•Systems Integration Services: A one-stop shop for complete turnkey solutions of customer-specified equipment installed in the Company’s cabinet or enclosure.
Our OSP solutions help service providers reduce operating costs, increase network quality and availability, improve time to market, and minimize capital costs while improving technician efficiency.
Recent Acquisitions
Acquisition of Cellular Specialties, Inc.
On March 1, 2014, the Company acquired 100% of Cellular Specialties, Inc. (CSI) stock for $39.0 million in cash plus a $5.0 million working capital adjustment. CSI, based in Manchester, New Hampshire, is an industry leader in the design and development of in-building wireless solutions including products for distributed antenna systems (DAS) installations, high-performance digital repeaters, and system components and antennas. The assets and liabilities acquired and the results of operations relating to CSI are included in the Company's Consolidated Financial Statements from the date of acquisition.
Acquisition of Kentrox, Inc.
On April 1, 2013, the Company acquired 100% of Kentrox, Inc. stock for $30.0 million in cash, subject to working capital adjustments and escrow provisions. Kentrox, based in Dublin, Ohio, is a worldwide leader in intelligent site management solutions, providing comprehensive M2M communications that enable operators to remotely monitor, manage, and control site support systems, reducing their operating costs while improving site performance and security. The assets and liabilities acquired and the results of operations relating to Kentrox are included in the Company's Consolidated Financial Statements from the date of acquisition.
Acquisition of certain assets and liabilities of ANTONE Wireless Corporation
On May 15, 2012, the Company acquired certain assets and liabilities of the ANTONE Wireless Corporation, based in Goleta, California, including rights to ANTONE products, for $2.5 million in cash, subject to working capital adjustments, plus contingent cash consideration of up to $3.5 million. The acquisition included inventories, property and equipment, contract rights, intangible assets, and certain specified operating liabilities that existed at the acquisition date. ANTONE products included tower mounted amplifiers (TMAs) and antenna sharing products. The contingent cash consideration is based upon profitability of the acquired products through June 30, 2016. The assets and liabilities acquired and the results of operations relating to ANTONE are included in the Company's Consolidated Financial Statements from the date of acquisition.
Customers
The Company's principal customers include telecommunications service providers, systems integrators, cell tower operators, and distributors. Telecommunication service providers include wireless and wireline service providers, multiple systems operators (MSOs), and Internet service providers.
Continuous industry consolidation among North American telecommunication service providers has reduced the number of customers for our solutions and products. As a result, the Company depends on fewer but larger customers for the majority of its revenues. The Company’s largest customer, Verizon, accounted for 30.5% of the Company's total revenues in fiscal year 2015.
While the Company historically has served customers predominantly in North America (U.S. and Canada), starting fiscal year 2014, as a result of the Kentrox acquisition, the Company had revenue with customers in Australia, South Africa, and Latin America. Customers outside North America represented approximately $3.7 million, $9.9 million and $2.4 million of the Company’s revenues in fiscal years 2015, 2014, and 2013, respectively, which represents approximately 4.4%, 9.7% and 6.2% of the Company's total revenues in such years.
Sales and Customer Support
We sell our solutions and products through our field sales organization, distributors, and partners. Customer contracts are primarily pricing and technical specification agreements that detail the commercial terms and conditions for sales. These agreements typically do not obligate the customer to a specific volume of purchases over time. The agreements may require the Company to accept returns of products within certain time limits, or indemnify customers against certain liabilities arising out of the use of the Company's solutions and products. If these claims or returns are significant, there could be a material adverse effect on the Company's business and results of operations.
In many instances, customers require vendor approval before deployment of solutions and products in their networks. Evaluation can take as little as a few months for products, but often longer for new solutions, products, and technologies. Accordingly, the Company is continually submitting successive generations of its current solutions and products, as well as new offerings, to its customers for approval.
We provide customer support, technical consulting, research assistance and training to some of our customers with respect to the installation, operation and maintenance of our products.
Most of our solutions and products carry a limited warranty ranging from one to seven years, which generally covers defects in materials or workmanship and failure to meet published specifications, but excludes damages caused by improper use. In the event there are material deficiencies or defects in our design or manufacture, the affected solutions and products could be subject to recall.
Supply Chain
We outsource the majority of our manufacturing to both domestic and international suppliers. Some CSG segment products such as TMAs, power distribution panels, and cabinet integration undergo final top-level assembly and testing at our Aurora, Illinois facility; and most IBW segment products undergo final top-level assembly and testing in Manchester, New Hampshire.
Reliance on third-party contract manufacturers (CMs) involves risks. Standard commercial components available from multiple suppliers are procured by the CMs. In some cases, where there are single-sourced components and technology needed, the Company has direct supplier relationships and contracts for these items, and may maintain inventory for these items at the CMs locations. Critical components, technology shortages, or business interruptions at our CMs could cause delays that may result in expediting costs or lost business.
A substantial portion of the Company's shipments in any fiscal period can relate to orders received in that period. Further, a significant percentage of orders may require delivery within forty-eight hours. To meet this demand, we maintain inventory at our facilities and at customer sites. Because of rapid technological changes, we face recurring risks that our inventory may become obsolete.
Research and Development
We believe our ability to maintain technological capabilities through enhancements of existing offerings and development of new solutions and products that meet customer needs is a critical component for success. We therefore expect to continue to devote substantial resources to research and development (R&D). In fiscal years 2015, 2014 and 2013, the Company's R&D expenses were approximately $17.3 million, $11.3 million, and $5.9 million, respectively.
The Company's R&D personnel are organized into teams, each responsible for sustaining technical support of existing solutions and products, conceiving new products in cooperation with other groups within the Company, and adapting standard products or technologies to meet new customer needs. Additionally, in an effort to remain a highly valued, superior quality, long-term supplier, each team is charged with reducing product costs for each succeeding generation of products without compromising functionality or serviceability. The teams leverage the Company’s relationships with its CMs and suppliers to achieve these cost reduction objectives.
We believe that the key to our R&D strategy is choosing an initial architecture for each product that balances innovation and time-to-market factors while enabling engineering innovations to result in future performance enhancements and cost reductions. The Company’s strategy is further enhanced by ensuring products are designed in conjunction with input from customers, procurement, CMs, and suppliers.
Our quality systems in the CSG segment, including product development processes, are registered to ISO9001:2008 International Quality System Standard and TL9000, which is the Telecommunication Industry's sector-specific version of the ISO9001:2008. The IBW facility is developing quality management systems with focus on registration to the ISO 9001:2008 and TL9000 standards. Many current critical processes required for managing the full product life cycle are already in place. Analysis of process and product performance, as well as monitoring of customer satisfaction and perception of IBW products and performance, are routinely reviewed and corrective actions taken where applicable. IBW successfully maintains TUV CE registration through quarterly audits in support of critical customer product offerings. Product realization is accomplished as required in the ISO 9001:2008 standard. Critical quality assurance processes such as calibration, control of nonconforming material, supplier evaluation and monitoring, and configuration management are all in place and audited routinely to insure the best product offerings possible to the customer. We believe product quality and reliability are critical and distinguishing factors in a customer’s selection process.
The Company’s products are subject to industry-wide standardization organizations, including Telcordia, the Internet Engineering Task Force, the Metro Ethernet Forum, the American National Standards Institute (ANSI) in the U.S. and the International Telecommunications Union (ITU).
Competition
We operate in an intensely competitive marketplace and have no reason to believe that this competitive environment will ease in the future. Our customers base their purchasing decisions on multiple factors including features, quality, performance, price, total cost of ownership, reliability, responsiveness, incumbency, financial stability, reputation, and customer service. While competitors vary by market, some of our primary competitors include Asentria, CCI, Charles Industries, CommScope, Corning, DPS Telecom, Emerson, Inala, Invendis Quest Controls, Purcell, Ruggedcom, TE Connectivity, and Telect. Some of these competitors compete with us across several of our solutions and products while many are a competitor to a specific solution or product.
Intellectual Property
The Company’s success depends, in part, on its ability to protect trade secrets, obtain or license patents, and operate without infringing on the rights of others. We rely on a combination of technical leadership, copyrights, trademarks, trade secrets, nondisclosure agreements, and other intellectual property and protective measures to secure our proprietary know-how. The expiration of any of the patents held by the Company would not have a material impact on the Company. From time to time, the Company expects to seek additional patents related to its R&D activities.
Backlog
Product shipments are generally made pursuant to standard purchase orders, which are officially acknowledged according to standard terms and conditions. Seasonality may cause revenue to differ from quarter to quarter. The CSG segment sells equipment that is installed outdoors and the ordering of such equipment declines during and in advance of the colder months. Budget cycles for our customers may also contribute to revenue variability in those same periods. Purchase orders are generally received less than a month prior to shipment.
As of May 14, 2015, and May 14, 2014, the IBW segment had $2.7 million and $1.3 million of backlog, respectively and the CSG segment had $11.4 million and $7.0 million, respectively.
Employees
As of May 1, 2015, the Company had 232 full-time employees. The following table reflects headcount by fiscal year 2016 segment and functional area.
|
| | | | | | | | | | | |
| IBW | | CSG | | Corporate | | Total |
Operations | 27 |
| | 46 |
| | — |
| | 73 |
|
Sales and marketing | — |
| | — |
| | 53 |
| | 53 |
|
Research and development | 40 |
| | 35 |
| | — |
| | 75 |
|
General and administrative | — |
| | — |
| | 31 |
| | 31 |
|
Total employees | 67 |
| | 81 |
| | 84 |
| | 232 |
|
Available Information
The SEC maintains an internet site, www.sec.gov, through which you may access the Company’s annual report on Form 10-K, quarterly reports on Form 10-Q, current reports on Form 8-K, proxy and other information statements, as well as amendments to these reports. In addition, the Company makes these reports available free of charge on the Company’s internet website, www.westell.com. The Company maintains a corporate governance page on the Company’s website. This page includes, among other items, the Code of Business Conduct, the Audit Committee Charter, the Compensation Committee Charter and the Corporate Governance and Nominating Committee Charter.
You should carefully consider the risks described below in addition to the other information contained and incorporated by reference in this Form 10-K/A. The risks described below are not the only risks facing us. Additional risks and uncertainties not currently known to us, or those risks we currently view to be immaterial, may also materially and adversely affect our business, operating results or financial condition. If any of these risks materialize, our business, operating results or financial condition could be materially and adversely affected.
Risks Related to Our Business
We have incurred losses in the past and may incur losses in the future.
We have incurred losses in recent fiscal years and historically in fiscal years through 2002. The Company had an accumulated deficit of $297.4 million as of March 31, 2015.
We also expect to continue to evaluate new product and growth opportunities. As a result, we will continue to invest in research and development and sales and marketing, which could adversely affect our short-term operating results. We cannot provide any certainty that we will be profitable in the future.
We depend on a limited number of customers who are able to exert a high degree of influence over us and loss or the reduction of spending of a major customer could adversely impact our business.
We have and may continue to depend on U.S. telecommunication service providers for the majority of our revenues. The telecommunications companies and our other customers are significantly larger than we are and are able to exert a high degree of influence over us. Customers may often be permitted to reschedule orders without penalty. Even if demand for our products is high, many telecommunication service providers have sufficient bargaining power to demand low prices and other terms and conditions that may materially adversely affect our business and operating results.
Our performance is dependent on customer capital spending, which can be volatile and difficult to forecast. Customer capital spending can be affected by end user demand driven by competing technology, economic conditions, customer budget restraints, work stoppages or other labor issues at the facilities at our customers and other factors. Our customers have curtailed or deferred spending in the past without notice.
Overall sales and product mix sold to our large customers have fluctuated in the past and could vary in the future resulting in significant fluctuations in quarterly operating results and may also adversely impact our stock price.
We have completed acquisitions and may engage in future acquisitions that could impact our financial results or stock price.
We recently completed acquisitions and expect to continue to review potential acquisitions, and we may acquire or make investments in businesses, products or technologies in the future. Any existing or substantial future acquisitions or investments would present a number of risks that could harm our business including:
| |
• | business integration issues; |
| |
• | disruption to our ongoing or our acquired business; |
| |
• | difficulty realizing the intended benefits of the transaction; |
| |
• | impairment of assets related to acquired goodwill and intangibles; and |
Future acquisitions or investments could also result in use of significant cash balances, potential dilutive issuances of equity securities or incurrence of debt, contingent liabilities or amortization expenses related to goodwill and other intangible assets, any of which could adversely affect our financial condition and results of operations.
We have long-term customer pricing contracts with a limited amount of coverage by way of long-term contracts or arrangements with suppliers, which could adversely affect our ability, with certainty or economically, to purchase components and technologies used in our products.
Although we have long-term customer pricing contracts, we have few long-term contracts or arrangements with our suppliers. We may not be able to obtain products or components at competitive prices, in sufficient quantities or under other commercially reasonable terms. We may be unable to pass any significant increase in product costs on to our customers, which could have an adverse impact on our financial results.
Our lack of backlog may affect our ability to adjust for unexpected changes in customer demand.
Customers often place orders for product within the month of their requested delivery date. We therefore typically do not have a material backlog (or known quantity) of unfilled orders, and our revenues in any quarter are substantially dependent on orders booked or orders becoming non-cancellable in that quarter. Our expense levels and inventory commitments are based on anticipated customer demand and are relatively fixed in the short term. If we enter into a high-volume or long-term supply arrangement and subsequently decide that we cannot use the products or services provided for in the supply arrangement then our business would also be harmed. We enter into short-term contracts with our suppliers in the form of purchase orders. These purchase orders are issued to vendors based on forecasted customer demand. Therefore, we may be unable to cancel purchase orders with our suppliers or adjust spending in a timely manner to compensate for any unexpected shortfall of orders. Accordingly, any significant shortfall of demand in relation to our expectations or any material delay of customer orders could have an adverse impact on our business, operating and financial results.
We face significant inventory risk
We are exposed to significant inventory risks that may adversely affect our operating results as a result of seasonality, new product launches, rapid changes in product cycles and pricing, defective products, changes in customer demand and spending patterns, and other factors. We endeavor to accurately predict these trends and avoid over-stocking or under-stocking products we assemble and/or sell. Demand for products, however, can change significantly between the time inventory or components are ordered/assembled and the date of customer orders. In addition, when we begin marketing a new product, it may be difficult to determine appropriate product or component selection, and accurately forecast demand. The acquisition of certain types of inventory or components may require significant lead-time and they may not be returnable. We carry a broad selection and significant inventory levels of certain products, and we may be unable to sell products in sufficient quantities. Any one of the inventory risk factors set forth above may adversely affect our operating results.
Conversely, if we order too little product to meet customer demand, we may have insufficient inventory which could result in unplanned expediting costs or lost revenue opportunities, either of which could have an adverse impact on our financial results.
We may experience delays in the development and deployment of new products.
Many of our past sales have resulted from our ability to anticipate changes in technology, industry standards and service provider service offerings, and to develop and introduce new and enhanced products and services. Our continued ability to adapt to such changes will be a significant factor in maintaining or improving our competitive position and our prospects for growth.
There can be no assurance that we will successfully introduce new products on a timely basis or achieve sales of new products in the future. In addition, there can be no assurance that we will have the financial and product design resources necessary to continue to successfully develop new products or to otherwise successfully respond to changing technology standards and service provider service offerings. If we fail to deploy new products on a timely basis, then our product sales will decrease and our competitive position and financial condition would be materially and adversely affected.
Our customers have lengthy purchase cycles and unpredictable purchasing practices that affect our ability to sell our products.
Prior to selling products to service providers, we must undergo lengthy approval and purchase processes. Evaluation can take as little as a few months for products that vary slightly from existing products or up to a year or more for products based on new technologies or utilized for new service offerings. Customers may also choose not to utilize our offerings. Accordingly, we are continually submitting successive generations of our current products as well as new products to our customers for approval.
The requirement that service providers obtain FCC or state regulatory approval for most new telecommunications and broadband services prior to their implementation has in the past delayed the approval process. Such delays in the future could have a material adverse effect on our business and operating results. While we have been successful in the past in obtaining product approvals from our customers, there is no guarantee that such approvals or that ensuing sales of such products will continue to occur.
Our business is subject to the risks of international operations.
We are dependent on our independent offshore manufacturing partners in Asia to manufacture, assemble and test our products. Although there typically is no unique capability with these suppliers, any failure or business disruption by these suppliers to meet delivery commitments would cause us to delay shipments and potentially lose revenue and/or incur contractual penalties. The reliance on third-party subcontractors for assembly of our products involves several risks, including the unavailability of, or interruptions in access to, certain process technologies and reduced control over product quality, delivery schedules, transportation, manufacturing yields, and costs. These risks may be exacerbated by economic or political uncertainties, terrorist actions, or by natural pandemics or other disasters in countries in which our subcontractors or their subcontractors are located. Contracts with our outsource manufacturing partners are generally expressed in U.S. dollars, but volatility in foreign currency rates could increase our costs.
We aim to derive an increased portion of our revenue from international operations. As a result, our financial condition and operating results could be significantly affected by risks associated with international activities, such as economic, political, and other risks and uncertainties, including, but not limited to, regional or country specific economic downturns, tax laws, fluctuations in currency exchange rates, complications in complying with, or exposure to liability under, a variety of laws and regulations, including anti-corruption laws and regulations, political instability and significant natural disasters and other events or factors impacting local infrastructure. Requirements for international expansion may increase our operating expenses or working capital needs.
Due to the rapid pace of technological change and volatile customer demand, our products may become obsolete and could cause us to incur charges for excess and obsolete inventory which would materially harm our business.
The telecommunications industry is subject to rapid technological change and volatile customer demands, which affected our past results and could result in inventory obsolescence or excess inventory. We have in the past and may in the future devote disproportionate resources to a product that we ultimately may not sell or have to sell for a loss. If we incur substantial inventory impairments that we are not able to recover because of changing market conditions, or if we commit resources that do not result in profitable sales, there could be a material adverse effect on our business, financial condition and results of operations.
Our products and services face intense competition. Our failure to compete successfully could materially affect our profitability.
Because we are smaller than many of our competitors, we may lack the financial, marketing, technical and other resources needed to increase or maintain our market share. Many of our competitors are larger than we are and may be able to offer a wider array of products and services required for a service provider’s business than we do.
Competitors may succeed in establishing more technologically advanced products and services, or products with more favorable pricing or may otherwise gain an advantage over our products which would result in lost business that would adversely impact our profitability.
Because of intense competition, we may price our products and services at low margins in order to win or maintain business. Low margins from our sales of products and services could materially and adversely affect our profitability and ability to achieve our business goals.
We are dependent on third-party technology, the loss of which would harm our business.
We rely on third parties for technology in our products. Consequently, the Company must rely upon third parties to develop and to introduce technologies which enhance the Company's current products and enable the Company, in turn, to develop its own products on a timely and cost-effective basis to meet changing customer needs and technological trends in the telecommunications industry. Were the Company to lose the ability to obtain needed technology from a supplier, or were that technology no longer available to the Company under reasonable terms and conditions, the Company’s business and results of operations could be materially and adversely affected.
Potential product recalls, service failures and warranty expenses could adversely affect our profitability.
Our products are required to meet rigorous standards imposed by our customers, and we warrant the performance of these products and services. In addition, our supply contracts with our major customers typically require us to accept returns of products within certain time frames and indemnify such customers against certain liabilities arising out of the use of our products or services. Complex products such as those offered by us may contain undetected defects or failures when first introduced or as new versions are released. Despite our testing of products and our comprehensive quality control program, there is no guarantee that our products will not suffer from defects or other deficiencies. If product defects, recalls, warranty returns, failures, indemnification or liquidated-damage claims exceed our anticipated costs for these items, our business could be harmed. Such claims and the associated negative publicity could result in the loss of or delay in market acceptance of our products and services, and could affect our product sales, our customer relationships, and our profitability.
We are dependent on sole or limited source suppliers, the loss of which would harm our business.
Components used in our products may be currently available from only one source or a limited number of suppliers. Our inabilities to obtain sufficient key components or to develop alternative sources for key components as required, could result in delays or reductions in product deliveries, and consequently severely harm our customer relationships and our business. Furthermore, additional sole-source components may be incorporated into our future products, thereby increasing our supplier risks. If any of our sole-source suppliers delay or halt production of any of their components, or fail to supply their components on commercially reasonable terms, then our business and operating results would be harmed.
In the event that these suppliers discontinue the manufacture of materials used in our products, we would be forced to incur the time and expense of finding a new supplier, if available, or to modify our products in such a way that such materials were not necessary, which could result in increased manufacturing costs.
New regulations related to conflict minerals could adversely impact our business.
The Dodd-Frank Wall Street Reform and Consumer Protection Act contains provisions concerning the supply of “conflict” minerals mined from the Democratic Republic of Congo and adjoining countries (DRC). As a result, the SEC established annual disclosure and reporting requirements for those companies who may use conflict minerals sourced from the DRC in their products. There will be costs associated with complying with these disclosure requirements, including diligence costs to determine the sources of conflict minerals used in our products. These new requirements also could limit the pool of suppliers who can provide conflict-free minerals and, as a result, we cannot ensure that we will be able to obtain these minerals at competitive prices. In addition, we may face challenges with our customers or with our reputation if we determine that certain of our products contain minerals not determined to be conflict free or if we are unable to sufficiently verify the origins of the minerals used in our products.
We may be subject to litigation that could be costly to defend and could impact our profitability.
Our products use third party and open source intellectual property. The telecommunications industry is characterized by the existence of an increasing number of patents and frequent litigation based on allegations of patent and other intellectual property infringement. From time to time we receive communications from third parties alleging infringement of exclusive patent, copyright and other intellectual property rights to technologies that are important to us. Such litigation, regardless of its outcome, could result in substantial costs and thus adversely impact our profitability. We could face securities litigation or other litigation that could result in the payment of substantial damages or settlement costs in excess of our insurance coverage. Any adverse outcome could harm our business. Even if we were to prevail in any such litigation, we could incur substantial legal costs and management's attention and resources could be diverted from our business which could cause our business to suffer.
We will not be able to successfully compete, develop and sell products and services if we fail to retain key personnel and hire additional key personnel.
Because of our need to continually compete for customer business, our success is dependent on our ability to attract and retain qualified technical, marketing, sales and management personnel. To remain competitive, we must maintain top management talent, employees who are involved in product development and testing and employees who have developed strong customer relationships. Because of the high demand for these types of employees, it may be difficult to retain existing key employees and attract new key employees. In addition, we do not have non-compete contracts with most of our employees. Our inability to attract and retain key employees could harm our ability to successfully sell existing products, develop new products, and implement our business goals.
Industry consolidation and divestiture could make competing more difficult.
Consolidation of companies offering competing products is occurring through acquisitions, joint ventures and licensing arrangements involving our competitors, our customers and our customers’ competitors.
Our customers may acquire, merge or divest territories to other telecommunication service providers. The acquiring companies often use competitor products in their legacy business. We are often required to formally bid to retain existing business or obtain new business in the acquirer’s territory.
We cannot provide any assurances that we will be able to compete successfully in an increasingly consolidated telecommunications industry or retain or win business when existing customers divest portions of their business to others. Any heightened competitive pressures that we may face may have a material adverse effect on our business, prospects, financial condition and results of operations.
Utilization of our deferred tax assets could be limited by an ownership change as defined by Section 382 of the Internal Revenue Code, or by a change in the tax code, or by our ability to generate future taxable income.
We have significant deferred tax assets, primarily in the form of net operating losses, which are generally available to offset future taxable income. If we fail to generate sufficient future taxable income, net operating losses would expire prior to utilization. A valuation allowance was recorded against all deferred tax assets in the fourth quarter of fiscal year 2013. A change in ownership, as defined by Section 382 of the Internal Revenue Code, could reduce the availability of those tax assets. In addition, some tax jurisdictions such as Illinois and California have suspended the use of net operating losses to offset future taxable income for certain years. Additional federal or state tax code changes could further limit our use of deferred tax assets and harm our business and our investors.
We have and may incur liabilities in connection with the sale of certain assets and discontinued operations.
In connection with our divestitures, we have agreed to indemnify parties against specified losses with respect to those transactions and retained responsibility for various legal liabilities that may accrue. The indemnities relate to, among other things, liabilities which may arise with respect to the period during which we operated the divested business, and to certain ongoing contractual relationships and entitlements with respect to which we made commitments in connection with the divestiture. We have incurred and may incur additional expenses defending indemnity and third party claims. These added expenses to resolve the claim or to defend against the third party action could harm our operating results. In addition, such claims may divert management attention from our continuing business. It may also be difficult to determine whether a claim from a third party stemmed from actions taken by us or by another party and we may expend substantial resources trying to determine which party has responsibility for the claim.
Any restructuring activities that we have undertaken and may undertake in the future may not achieve the benefits anticipated and could result in additional unanticipated costs, which could have a material adverse effect on our business, financial condition, cash flows or results of operations.
In order to align our resources with our growth strategies, operate more efficiently and control costs, we have periodically announced restructuring plans, which include workforce reductions, facility closures and consolidations, asset impairments and other cost reduction initiatives. We regularly evaluate our existing operations and, as a result of such evaluations, may undertake additional restructuring activities within our business. These restructuring activities may involve higher costs or longer timetables than we anticipate, including costs related to severance and other employee-related matters, litigation risks and expenses, and other costs. These restructuring activities may disrupt sales or operations and may not result in improvements in future financial performance. If we incur unanticipated costs or are unable to realize the benefits related to restructuring activities, the activities could have a material adverse effect on our business, financial condition, cash flows or results of operations.
An impairment of goodwill or other intangible assets could adversely impact our reported financial results.
At least annually, we are required to test our goodwill to determine if impairment has occurred. Events or circumstances could arise that may create a need to record an impairment adjustment related to our goodwill or other intangible assets that could adversely impact our reported financial results. Goodwill impairment charges were recorded in fiscal years 2013 and 2015 that reduced goodwill balances existing at that time to zero.
Our business may be affected by uncertain government regulation, and current or future laws or regulations could restrict the way we operate our business or impose additional costs on our business.
The telecommunications industry, including most of our customers, is subject to regulation from federal and state agencies, including the FCC and various state public utility and service commissions. While most such regulations do not affect us directly, the effects of regulations on our customers may adversely impact our business and operating results. For example, FCC regulatory policies affecting the availability of telecommunication company services and other terms on which telecommunication companies conduct their business may impede our penetration of local access markets, and/or make the markets less financially attractive.
Risks Related to our Common Stock
Our stock price is volatile and could drop unexpectedly.
Our stock price has demonstrated and may continue to demonstrate volatility as valuations, trading volumes and prices vary significantly. Such volatility may result in a material decline in the market price of our securities, and may have little relationship to our financial results or prospects.
We could be the subject of future investigation by the SEC or other governmental authorities that could adversely affect our financial condition, results of operations and the price of our common stock.
In the event that an investigation by the SEC or other governmental authorities leads to significant legal expense or to action against the Company or its directors and officers, our financial condition, results of operations and the price of our common stock may be adversely impacted.
Our principal stockholders can exercise significant influence that could discourage transactions involving a change of control and may affect your ability to receive a premium for Class A Common Stock that you purchase.
As of May 14, 2015, as trustees of a voting trust dated February 23, 1994, (the Voting Trust) containing common stock held for the benefit of the Penny family, Robert C. Penny III, Robert W. Foskett and Patrick J. McDonough, Jr. have the exclusive power to vote over 50.5% of the votes entitled to be cast by the holders of our common stock. In addition, members of the Penny family who are beneficiaries under this Voting Trust are parties to a stock transfer restriction agreement which prohibits the beneficiaries from transferring any Class B Common Stock or their beneficial interests in the Voting Trust without first offering such Class B Common Stock to the other Penny family members. Certain Penny family members also own or are beneficiaries of trusts that own shares outside of the Voting Trust. As trustees of the Voting Trust and other trusts, Messrs. Penny, Foskett and McDonough, Jr. control 54.4% of the stock vote. Consequently, we are effectively under the control of Messrs. Penny, Foskett and McDonough, Jr., as trustees, who can effectively control the election of all of the directors and determine the outcome of most corporate transactions or other matters submitted to the stockholders for approval. Such control may have the effect of discouraging transactions involving an actual or potential change of control, including transactions in which the holders of Class A Common Stock might otherwise receive a premium for their shares over the then-current market price.
Our Class A Common Stock could be delisted from the NASDAQ Global Select Market.
NASDAQ has established certain standards for the continued listing of a security on the NASDAQ Global Select Market. The standards for continued listing include, among other things, that the minimum bid price for the listed securities be at least $1.00 per share. Although the Company is currently in compliance with the minimum bid price requirement, in the future we may not satisfy the NASDAQ’s continued listing standards. If we do not satisfy any of the NASDAQ’s continued listing standards, the Company’s Class A Common Stock could be delisted. Any such delisting could adversely affect the market liquidity of our Class A Common Stock and the market price of our Class A Common Stock could decrease. A delisting could adversely affect our ability to obtain financing for our operations and/or result in a loss of confidence by investors, customers, suppliers or employees.
|
| |
ITEM 1B. | UNRESOLVED STAFF COMMENTS |
None.
The Company leases the following real property:
|
| | | | | | | | | |
Location | | Purpose | | Square footage | | Termination year | | Segment |
Aurora, IL | | Corporate headquarters, office, CSG distribution and manufacturing | | 179,000 |
| | 2017 | | |
Regina, Saskatchewan, Canada | | Design center | | 2,500 |
| | 2017 | | CSG |
Dublin, OH | | Design center | | 9,465 |
| | 2019 | | CSG |
Manchester, NH | | IBW distribution and manufacturing | | 16,932 |
| | 2018 | | IBW |
Manchester, NH | | IBW office | | 19,525 |
| | 2018 | | IBW |
The Company consolidated office space in its corporate headquarters in March, 2015 and is utilizing 31,000 square feet of office space and 86,000 square feet of distribution and manufacturing space with 62,000 of office space vacant.
On April 1, 2013, as a result of the Kentrox acquisition, the Company acquired a sixteen acre parcel of land in Dublin, Ohio. The Company sold four acres in April 2015 and is marketing the remaining twelve acres for sale.
The Company is involved in various legal proceedings incidental to the Company’s business and its previously owned operations. In the ordinary course of our business, we are routinely audited and subject to inquiries by governmental and regulatory agencies. Although it is not possible to predict with certainty the outcome of these or other unresolved legal actions or the range of possible loss, management believes that the outcome of such proceedings will not have a material adverse effect on our consolidated operations or financial condition.
|
| |
ITEM 4. | MINE SAFETY DISCLOSURES |
Not Applicable.
PART II
|
| |
ITEM 5. | MARKET FOR REGISTRANT’S COMMON EQUITY, RELATED STOCKHOLDER MATTERS AND ISSUER PURCHASES OF EQUITY SECURITIES |
The Company’s Class A Common Stock is quoted on the NASDAQ Global Select Market under the symbol “WSTL”. The following table sets forth for the periods indicated the high and low sale prices for the Class A Common Stock as reported on the NASDAQ Global Select Market.
|
| | | | | | | |
| High | | Low |
Fiscal Year 2015 | | | |
First Quarter ended June 30, 2014 | $ | 3.99 |
| | $ | 2.21 |
|
Second Quarter ended September 30, 2014 | 2.59 |
| | 1.62 |
|
Third Quarter ended December 31, 2014 | 1.87 |
| | 1.22 |
|
Fourth Quarter ended March 31, 2015 | 1.60 |
| | 0.96 |
|
Fiscal Year 2014 | | | |
First Quarter ended June 30, 2013 | $ | 2.57 |
| | $ | 1.90 |
|
Second Quarter ended September 30, 2013 | 3.65 |
| | 2.35 |
|
Third Quarter ended December 31, 2013 | 4.90 |
| | 3.28 |
|
Fourth Quarter ended March 31, 2014 | 4.73 |
| | 3.27 |
|
As of May 14, 2015, there were approximately 448 holders of record of the outstanding shares of Class A Common Stock and five holders of record of Class B Common Stock.
During the fiscal year ended March 31, 2015, no equity securities of the Company were sold by the Company that were not registered under the Securities Act of 1933, as amended.
Dividends
The Company has never declared or paid cash dividends on its common stock and does not anticipate paying cash dividends in the foreseeable future.
Issuer Purchases of Equity Securities
The following table provides information about the Company’s repurchase activity for its Class A Common Stock during the three months ended March 31, 2015.
|
| | | | | | | | | | | | | |
Period | Total Number of Shares Purchased (a) | | Average Price Paid per Share | | Total Number of Shares Purchased as Part of Publicly Announced Programs (b) | | Maximum Number (or Approximate Dollar Value) that May Yet Be Purchased Under the Programs (b) |
January 1-31, 2015 | — |
| | $ | — |
| | — |
| | $ | 112,741 |
|
February 1-28, 2015 | 69,661 |
| | $ | 1.4700 |
| | — |
| | $ | 112,741 |
|
March 1-31, 2015 | 46,711 |
| | $ | 1.4688 |
| | — |
| | $ | 112,741 |
|
Total | 116,372 |
| | $ | 1.4695 |
| | — |
| | $ | 112,741 |
|
| |
(a) | In the quarter ended March 31, 2015, the Company repurchased 116,372 shares from employees that were surrendered to satisfy the minimum statutory tax withholding obligations on the vesting of restricted stock units. These repurchases, which are not included in the authorized share repurchase program, had a weighted-average purchase price of $1.47 per share. |
| |
(b) | In August 2011, the Board of Directors authorized a share repurchase program whereby the Company could repurchase up to an additional aggregate of $20.0 million of its outstanding Class A Common Stock. There was approximately $0.1 million remaining under this program as of March 31, 2015. |
Performance Graph
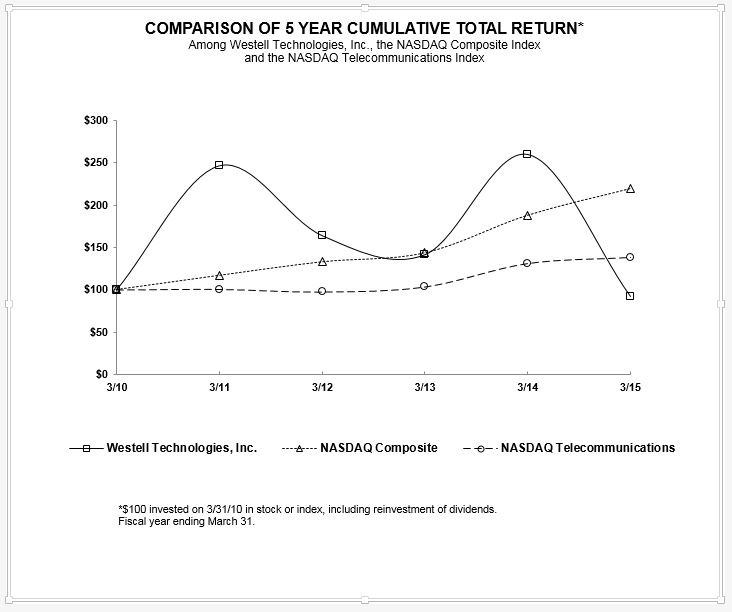
The following performance graph compares the change in the Company’s cumulative total stockholder return on its Class A Common Stock with the cumulative total return of the NASDAQ Composite Index and the NASDAQ Telecommunications Index for the period commencing March 31, 2010 and ending March 31, 2015. The stock price performance shown in the performance graph may not be indicative of future stock performance price.
|
| | | | | | | | | | | | | | | | | |
| 3/10 | | 3/11 | | 3/12 | | 3/13 | | 3/14 | | 3/15 |
Westell Technologies, Inc. | 100.00 |
| | 246.48 |
| | 164.08 |
| | 141.55 |
| | 259.86 |
| | 92.25 |
|
NASDAQ Composite | 100.00 |
| | 116.88 |
| | 132.91 |
| | 143.55 |
| | 188.17 |
| | 219.78 |
|
NASDAQ Telecommunications | 100.00 |
| | 100.68 |
| | 97.60 |
| | 103.52 |
| | 130.88 |
| | 137.97 |
|
|
| |
ITEM 6. | SELECTED FINANCIAL DATA |
The following selected consolidated financial data as of March 31, 2015, 2014, 2013, 2012 and 2011 and for each of the five fiscal years in the period through fiscal year 2015 have been derived from the Company's Consolidated Financial Statements included in this amended filing and has been adjusted for the effects of the restatement as described in Note 1 to the Consolidated Financial Statements. The Company sold its ConferencePlus subsidiary in fiscal year 2012 and is reporting the results of ConferencePlus as discontinued operations. The Company discontinued the operations of the historical CNS segment in the first quarter of fiscal year 2014 and is reporting the CNS segment results as discontinued operations. The data set forth below is qualified by reference to, and should be read in conjunction with, "Management's Discussion and Analysis of
Financial Condition and Results of Operations”, the Consolidated Financial Statements and the related Notes thereto and other financial information appearing elsewhere in this Annual Report on Form 10-K/A.
|
| | | | | | | | | | | | | | | | | | | |
(in thousands, except per share data) | Fiscal Year Ended March 31, |
Statement of Operations Data: | 2015
(as restated (1)) | | 2014 (as restated and adjusted (1)(2)(3)) | | 2013
(as adjusted (3)) | | 2012
(as adjusted (3)) | | 2011
(as adjusted (3)) |
Revenue | $ | 84,127 |
| | $ | 102,073 |
| | $ | 38,808 |
| | $ | 43,629 |
| | $ | 58,770 |
|
Cost of revenue | 57,317 |
| | 61,612 |
| | 26,192 |
| | 27,144 |
| | 35,088 |
|
Gross profit | 26,810 |
| | 40,461 |
| | 12,616 |
| | 16,485 |
| | 23,682 |
|
Operating expenses: | | | | | | | | | |
Sales and marketing | 12,407 |
| | 13,304 |
| | 6,783 |
| | 5,156 |
| | 7,959 |
|
Research and development | 17,348 |
| | 11,339 |
| | 5,928 |
| | 5,460 |
| | 5,038 |
|
General and administrative | 14,678 |
| | 14,027 |
| | 9,310 |
| | 6,996 |
| | 8,623 |
|
Intangible amortization | 6,377 |
| | 4,889 |
| | 887 |
| | 544 |
| | — |
|
Restructuring | 3,243 |
| | 335 |
| | 149 |
| | 276 |
| | — |
|
Goodwill impairment | 31,997 |
| | — |
| | 2,884 |
| | — |
| | 540 |
|
Total operating expenses | 86,050 |
| | 43,894 |
| | 25,941 |
| | 18,432 |
| | 22,160 |
|
Operating income (loss) from continuing operations | (59,240 | ) | | (3,433 | ) | | (13,325 | ) | | (1,947 | ) | | 1,522 |
|
Other income (expense), net | (2 | ) | | (56 | ) | | 175 |
| | 331 |
| | 20 |
|
Income (loss) before income tax and before discontinued operations | (59,242 | ) | | (3,489 | ) | | (13,150 | ) | | (1,616 | ) | | 1,542 |
|
Income tax (expense) benefit | 201 |
| | 7,910 |
| | (29,392 | ) | | 686 |
| | 53,326 |
|
Net income (loss) from continuing operations | (59,041 | ) | | 4,421 |
| | (42,542 | ) | | (930 | ) | | 54,868 |
|
Income (loss) from discontinued operations, net of income tax | 139 |
| | (45 | ) | | (1,496 | ) | | 42,912 |
| | 13,068 |
|
Net income (loss) | $ | (58,902 | ) | | $ | 4,376 |
| | $ | (44,038 | ) | | $ | 41,982 |
| | $ | 67,936 |
|
Basic net income (loss) per share: | | | | | | | | | |
Basic net income (loss) from continuing operations | $ | (0.98 | ) | | $ | 0.08 |
| | $ | (0.71 | ) | | $ | (0.01 | ) | | $ | 0.81 |
|
Basic net income (loss) from discontinued operations | — |
| | — |
| | (0.02 | ) | | 0.64 |
| | 0.19 |
|
Basic net income (loss) per share (4) | $ | (0.98 | ) | | $ | 0.07 |
| | $ | (0.73 | ) | | $ | 0.63 |
| | $ | 1.00 |
|
Weighted average number of basic common shares outstanding | 59,985 |
| | 58,786 |
| | 59,944 |
| | 66,657 |
| | 67,848 |
|
Diluted net income (loss) per share: | | | | | | | | | |
Diluted net income (loss) from continuing operations | $ | (0.98 | ) | | $ | 0.07 |
| | $ | (0.71 | ) | | $ | (0.01 | ) | | $ | 0.79 |
|
Diluted net income (loss) from discontinued operations | — |
| | — |
| | (0.02 | ) | | 0.64 |
| | 0.19 |
|
Diluted net income (loss) per share | $ | (0.98 | ) | | $ | 0.07 |
| | $ | (0.73 | ) | | $ | 0.63 |
| | $ | 0.98 |
|
Weighted average number of diluted common shares outstanding | 59,985 |
| | 60,048 |
| | 59,944 |
| | 66,657 |
| | 69,477 |
|
Balance Sheet Data (at end of period): | | | | | | | | | |
Cash and cash equivalents | $ | 14,026 |
| | $ | 35,793 |
| | $ | 88,233 |
| | $ | 120,832 |
| | $ | 86,408 |
|
Working capital (5) | 18,295 |
| | 23,386 |
| | 12,637 |
| | 12,461 |
| | 29,457 |
|
Total assets | 100,377 |
| | 162,319 |
| | 142,437 |
| | 197,426 |
| | 201,387 |
|
Total stockholders’ equity | $ | 81,739 |
| | $ | 138,642 |
| | $ | 131,077 |
| | $ | 186,364 |
| | $ | 159,281 |
|
(1) Certain amounts have been restated to reflect adjustments related to the correction of an error (see Note 1 to the Consolidated Financial Statements for additional information).
(2) Certain amounts have been adjusted to reflect measurement period adjustments related to the CSI acquisition (see Note 2 to the Consolidated Financial Statements for additional information on recent acquisitions and divestitures).
(3) Certain amounts have been reclassified to reflect a change in accounting principle (see Note 1 to the Consolidated Financial Statements for additional information).
(4) Totals may not sum due to rounding.
(5) Working capital is defined as current assets less cash and cash equivalents, restricted cash, short-term investments and current liabilities.
|
| |
ITEM 7. | MANAGEMENT'S DISCUSSION AND ANALYSIS OF FINANCIAL CONDITION AND RESULTS OF OPERATIONS |
Overview
The following discussion should be read together with the Consolidated Financial Statements and the related Notes thereto and other financial information appearing elsewhere in this Form 10-K/A. All references herein to the term “fiscal year” shall mean a year ended March 31 of the year specified. All of the financial information presented in this Item 7 has been revised to reflect the restatement of the consolidated financial statements more fully described in Note 1 to the Consolidated Financial Statements.
Westell Technologies, Inc., (the Company) is a leading provider of in-building wireless, intelligent site management, cell site optimization, and outside plant solutions focused on innovation and differentiation at the edge of telecommunication networks, where end users connect. The Company’s comprehensive set of products and solutions are designed to advance network performance for carriers, integrators, and other network operators, allowing them to reduce operating costs and improve network performance. With millions of products successfully deployed worldwide, the Company is a trusted partner for transforming networks into high performance, reliable systems.
The Company's two business segments, In-Building Wireless and Communication Solutions Group, are engaged in the design, development, assembly, and marketing of a wide variety of products and solutions.
Beginning in August 2014, the Company experienced significant reductions in customer capital spending, which adversely impacted the Company’s second and third quarter revenue, margins, and earnings in both segments. In this regard, when comparing the revenue from five customers in fiscal year 2014 to the same five customers in fiscal year 2015, the decline was 42%. While we expected customer capital spending to improve in the beginning of calendar 2015 (our fourth fiscal quarter), the customer spending has been slow to start thus far. Going forward, we expect customer capital spending to increase because end-user bandwidth needs continue to grow.
On January 30, 2015, the Company approved a plan to restructure its business, including reduction of headcount and consolidation of office space within the Aurora headquarters facility, with the intent to optimize operations. The restructuring was completed during the fourth quarter of fiscal year 2015 and impacted 17 employees. The Company recognized a restructuring expense of$3.2 million in the three months ended March 31, 2015, including a non-cash charge of $2.7 million in other associated costs related to a loss on a lease. The loss on the lease includes lease liabilities offset by estimated sublease income. The reorganization costs are expected to be paid by fiscal year 2018 concurrent with the termination date of the contractual lease.
In fiscal year 2015, the Company operated under two reportable segments: In-Building Wireless and Communication Solutions Group.
In-Building Wireless (IBW) Segment
The IBW segment solutions include distributed antenna systems (DAS) conditioners, high-performance digital repeaters and bi-directional amplifiers (BDAs), and system components and antennas, all used by wireless service providers and neutral-party hosts to fine tune radio frequency (RF) signals that helps extend coverage to areas not served well or at all by traditional cell sites. The IBW segment includes the comprehensive suite of products and solutions acquired with the addition of CSI, as well as our internally developed DAS interface panels. The CSI acquisition, which closed in March 2014, significantly expanded our product portfolio, enabling us to better compete in the growing in-building wireless market, where we expect to increase our revenue and profitability.
Communication Solutions Group (CSG) Segment
The CSG segment solutions include intelligent site management (ISM), cell site optimization (CSO), and outside plant (OSP) as follows:
• ISM solutions include a suite of Remote monitoring and control devices which, when combined with the Company's Optima management system, provides comprehensive machine-to-machine (M2M) communications that enable operators to remotely monitor, manage, and control site infrastructure and support systems.
• CSO solutions consist of tower mounted amplifiers (TMAs), small outdoor-hardened units mounted next to antennas on cell towers, enabling wireless service providers to improve the overall performance of a cell site, including increasing data throughput and reducing dropped connections.
• OSP solutions, which are sold to wireline and wireless service providers as well as industrial network operators, consist of a broad range of offerings, including cabinets, enclosures, and mountings; synchronous optical networks/time division multiplexing (SONET/TDM) network interface units; power distribution units; copper and fiber connectivity panels; hardened Ethernet switches; and systems integration services.
Customers
The Company’s customer base for its products is highly concentrated and include telecommunications service providers, systems integrators, cell tower operators, and distributors. Telecommunication service providers include wireless and wireline service providers, multiple systems operators (MSOs), and Internet service providers. Due to the stringent customer quality specifications and the regulated environment in which its customers operate, the Company must undergo lengthy approval and procurement processes prior to selling most of its products. Accordingly, the Company must make significant up-front investments in product and market development prior to actual commencement of sales of new products. The prices for the Company's products vary based upon volume, customer specifications, and other criteria, and they are subject to change for a variety of reasons, including cost and competitive factors.
To remain competitive, the Company must continue to invest in new product development and in targeted sales and marketing efforts to launch new product lines. Failure to increase revenues from new products, whether due to lack of market acceptance, competition, technological change meeting technical specifications or otherwise, could have a material adverse effect on the Company's business and results of operations. The Company expects to continue to evaluate new product opportunities and invest in product research and development activities.
In view of the Company’s reliance on the telecommunications market for revenues, the project nature of the business, and the unpredictability of orders and pricing pressures, the Company believes that period-to-period comparisons of its financial results are not necessarily meaningful and should not be relied upon as an indication of future performance. The Company has experienced quarterly fluctuations in customer ordering and purchasing activity due primarily to the project-based nature of the business and to budgeting and procurement patterns toward the end of the calendar year or the beginning of a new year. While these factors can result in the greatest fluctuations in the Company's third and fourth fiscal quarters, this is not always consistent and may not always correlate to financial results.
Critical Accounting Policies
The preparation of financial statements in accordance with GAAP requires management to make use of certain estimates and assumptions that affect the reported amounts of assets and liabilities and the disclosure of contingent assets and liabilities at the date of the financial statements, and that affect the reported amounts of revenue and expenses during the reported periods. The Company bases estimates on historical experience and on various other assumptions that management believes are reasonable under the circumstances. These estimates and assumptions form the basis for judgments about carrying values of assets and liabilities that may not be readily apparent from other sources. Actual results could differ from the amounts reported.
In Note 3 to the Consolidated Financial Statements, the Company includes a discussion of its significant accounting policies. The Company believes the following are the most critical accounting policies and estimates used in the preparation of the financial statements. The Company considers an accounting policy or estimate to be critical if it requires assumptions to be made concerning uncertainties, and if changes in these assumptions could have a material impact on financial condition or results of operations.
Business Combinations
The Company applies the guidance of ASC topic 805, Business Combinations. The Company recognizes the fair value of assets acquired and liabilities assumed in transactions; establishes the acquisition date fair value as the measurement objective for all assets acquired and liabilities assumed; expenses transaction and restructuring costs; and discloses the information needed to evaluate and understand the nature and financial effect of the business combination.
Inventories and Inventory Valuation
Inventories are stated at the lower of first-in, first-out (FIFO) cost or market value. Market value is based upon an estimated average selling price reduced by estimated costs of disposal. Should actual market conditions differ from the Company’s estimates, the Company’s future results of operations could be materially affected. Reductions in inventory valuation are included in cost of goods sold in the accompanying Consolidated Statements of Operations. The Company reviews inventory for excess quantities and obsolescence based on its best estimates of future demand, product lifecycle status and product development plans. The Company uses historical information along with these future estimates to reduce the inventory cost basis. Subsequent changes in facts and circumstances do not result in the restoration or increase in that newly established cost basis. Prices anticipated for future inventory demand are compared to current and committed inventory values.
Inventory Purchase Commitments
In the normal course of business, the Company enters into non-cancellable commitments for the purchase of inventory. The commitments are negotiated to be at market rates. Should there be a significant decline in revenues the Company may absorb excess inventory and subsequent losses as a result of these commitments. The Company establishes reserves for potential losses on at-risk commitments.
Income Taxes
The Company accounts for income taxes under the provisions of ASC topic 740, Income Taxes (ASC 740). ASC 740 requires an asset and liability based approach in accounting for income taxes. Deferred income tax assets, including net operating loss (NOL) and certain tax credit carryovers and liabilities, are recorded based on the differences between the financial statement and tax bases of assets and liabilities, applying enacted statutory tax rates in effect for the year in which the tax differences are expected to reverse. Valuation allowances are provided against deferred tax assets which are assessed as not likely to be realized. On a quarterly basis, management evaluates the recoverability of deferred tax assets and the need for a valuation allowance. This evaluation requires the use of estimates and assumptions and considers all positive and negative evidence and factors, such as the scheduled reversal of temporary differences, the mix of earnings in the jurisdictions in which the Company operates, and prudent and feasible tax planning strategies. Deferred tax assets and liabilities are adjusted for the effects of changes in tax laws and rates on the dates of enactment. The Company accounts for unrecognized tax benefits based upon its assessment of whether a tax benefit is more likely than not to be sustained upon examination by tax authorities. The Company reports a liability for unrecognized tax benefits resulting from unrecognized tax benefits taken or expected to be taken in a tax return and recognizes interest and penalties, if any, related to its unrecognized tax benefits in income tax expense. See Note 4 for further discussion of the Company’s income taxes.
Goodwill and Other Intangibles
Goodwill is the excess of the total purchase consideration transferred over the amounts allocated to identifiable assets acquired and liabilities assumed at the acquisition date. Goodwill is not amortized, but it is tested for impairment at the reporting unit level by first performing a qualitative approach to test goodwill for impairment to determine whether it is more likely than not that the fair value of a reporting unit is less than its carrying value. If it is concluded that this is the case, it is necessary to perform the two-step, quantitative, goodwill impairment test. Otherwise, the two-step goodwill impairment test is not required.
Goodwill is reviewed for impairment at least annually in accordance with ASC topic 350, Intangibles-Goodwill and Other, or when an event occurs or circumstances change between annual tests that would more likely than not reduce the fair value of the reporting unit below its carrying value. The Company performs its annual impairment test in the fourth quarter of each fiscal year and begins with a qualitative assessment to determine if it is more likely than not that the fair value of a reporting unit is less than its carrying value.
If the Company concludes that it is more likely than not that the fair value of a reporting unit is less than its carrying value, it is necessary to perform a two-step goodwill impairment test. The first step tests for impairment by applying fair value-based tests at the reporting unit level. Fair value of a reporting unit is determined by using both an income approach and a market approach, because this combination is considered to produce the most reasonable indication of fair value in an orderly transaction between market participants. Under the income approach, the Company determines fair value based on estimated future cash flows of a reporting unit, discounted by an estimated weighted-average cost of capital, which reflects the level of risk inherent in a reporting unit and its associated estimates of future cash flows as well as the rate of return an experienced investor might expect to earn. Discount rate assumptions are considered Level 3 inputs in the fair value hierarchy defined in ASC topic 820, Fair Value Measurements and Disclosures. Under the market approach, the Company utilizes valuation multiples derived from publicly available information for comparable companies to provide an indication of how much a knowledgeable investor in the marketplace might be willing to pay for a company. The second step (if necessary) measures the amount of impairment by applying fair-value-based tests to individual assets and liabilities within each reporting unit.
If the Company concludes that it is more likely than not that the fair value of an indefinite-lived intangible asset is less than its carrying value, a quantitative fair value assessment is performed and compared to the carrying value. If the fair value is less than the carrying value, impairment is recorded.
Intangible assets with determinable lives are amortized on a straight-line basis over their respective estimated useful lives. If the Company were to determine that a change to the remaining estimated useful life of an intangible asset was necessary, then the remaining carrying amount of the intangible asset would be amortized prospectively over that revised remaining useful life. On an ongoing basis, the Company reviews intangible assets with a definite life and other long-lived assets other than goodwill for impairment whenever events and circumstances indicate that carrying values may not be recoverable. If such events or changes in circumstances occur, the Company will recognize an impairment loss if the undiscounted future cash flow expected
to be generated by the asset is less than the carrying value of the related asset. Any impairment loss would adjust the asset to its implied fair value.
Revenue Recognition and Deferred Revenue
The Company's revenue is derived from the sale of products, software, and services. The Company records revenue from product sales transactions when title and risk of loss are passed to the customer, there is persuasive evidence of an arrangement for sale, delivery has occurred and/or services have been rendered, the sales price is fixed or determinable, and collectability is reasonably assured.
Revenue recognition on equipment where software is incidental to the product as a whole, or where software is essential to the equipment’s functionality and falls under software accounting scope exceptions, generally occurs when products are shipped, risk of loss has transferred to the customer, objective evidence exists that customer acceptance provisions have been met, no significant obligations remain, collection is reasonably assured and warranty can be estimated.
Revenue recognition where software that is more than incidental to the product as a whole or where software is sold on a standalone basis is recognized when the software is delivered and ownership and risk of loss are transferred.
The Company also recognizes revenue from deployment services, maintenance agreements, training and professional services. Deployment services revenue results from installation of products at customer sites. Deployment services, which generally occur over a short time period, are not services required for the functionality of products, because customers do not have to purchase installation services from the Company, and may install products themselves, or hire third parties to perform the installation services. Revenue for deployment services, training and professional services are recognized upon completion and acceptance. Revenue from maintenance agreements is recognized ratably over the service period.
When a multiple element arrangement exists, the fee from the arrangement is allocated to the various deliverables so that the proper amount can be recognized as revenue as each element is delivered. Based on the composition of the arrangement, the Company analyzes the provisions of the accounting guidance to determine the appropriate model that is applied towards accounting for the multiple element arrangement. If the arrangement includes a combination of elements that fall within different applicable guidance, the Company follows the provisions of the hierarchal literature to separate those elements from each other and apply the relevant guidance to each.
If deliverables do not fall within the software revenue recognition guidance, the fair value of each element is established using the relative selling price method, which requires the Company to use vendor-specific objective evidence (VSOE), reliable third-party objective evidence or management's best estimate of selling price, in that order.
If deliverables fall within the software revenue recognition guidance, the fee is allocated to the various elements based on VSOE of fair value. If sufficient VSOE of fair value does not exist for the allocation of revenue to all the various elements in a multiple element arrangement, all revenue from the arrangement is deferred until the earlier of the point at which such sufficient VSOE of fair value is established or all elements within the arrangement are delivered. If VSOE of fair value exists for all undelivered elements, but does not exist for one or more delivered elements, the arrangement consideration is allocated to the various elements of the arrangement using the residual method of accounting. Under the residual method, the amount of the arrangement consideration allocated to the delivered elements is equal to the total arrangement consideration less the aggregate fair value of the undelivered elements. Using this method, any potential discount on the arrangement is allocated entirely to the delivered elements, which ensures that the amount of revenue recognized at any point in time is not overstated. Under the residual method, if VSOE of fair value exists for the undelivered element, generally maintenance, the fair value of the undelivered element is deferred and recognized ratably over the term of the maintenance contract, and the remaining portion of the arrangement is recognized as revenue upon delivery, which generally occurs upon delivery of the product.
The Company has established VSOE based on its historical pricing practices. The application of VSOE methodologies requires judgment, including the identification of individual elements in multiple element arrangements and whether there is VSOE of fair value for some or all elements.
The Company’s product return policy allows customers to return unused equipment for partial credit if the equipment is non-custom product, returned within specified time limits, and currently being manufactured and sold. Credit is not offered on returned products that are no longer manufactured and sold.
The Company records revenue net of taxes in accordance with ASC topic 605, Revenue Recognition (ASC 605).
Stock–Based Compensation
The Company recognizes stock-based compensation expense for all employee stock-based payments based upon the fair value on the awards grant date over the requisite service period. If the awards are performance based, the Company must estimate future performance attainment to determine the number of awards expected to vest. Determining the fair value of equity-based
options requires the Company to estimate the expected volatility of its stock, the risk-free interest rate, expected option term, expected dividend yield and expected forfeitures.
Product Warranties
Most of the Company’s products carry a limited warranty of up to seven years. The Company accrues for estimated warranty costs as products are shipped based on historical sales and cost of repair or replacement trends relative to sales.
Results of Operations
Fiscal Years Ended March 31, 2015, 2014 and 2013
|
| | | | | | | | | | | | | | | | | | | |
Revenue | Fiscal Year Ended March 31, | | Increase (Decrease) |
(in thousands) | 2015 | | 2014 | | 2013 | | 2015 vs.
2014 | | 2014 vs.
2013 |
IBW | $ | 37,714 |
| | $ | 13,096 |
| | $ | 904 |
| | $ | 24,618 |
| | $ | 12,192 |
|
CSG | 46,413 |
| | 88,977 |
| | 37,904 |
| | (42,564 | ) | | 51,073 |
|
Consolidated revenue | $ | 84,127 |
| | $ | 102,073 |
| | $ | 38,808 |
| | $ | (17,946 | ) | | $ | 63,265 |
|
In fiscal year 2015, consolidated revenue decreased by $17.9 million compared to fiscal year 2014. The Company experienced a significant decrease in its fiscal third quarter 2015 revenue as the large North American wireless service providers, the Company's largest customers, significantly slowed down their capital spending during this period. This negatively impacted the Company's revenue across most product lines. The IBW segment revenue increased $24.6 million from the acquisition of CSI where one month of revenue was included in fiscal year 2014 compared to 12 months of revenue in fiscal year 2015. The CSG segment revenue decreased $42.6 million. The revenue decline resulted primarily from the reduction in sales of ISM products of $32.6 million. In fiscal year 2014, ISM revenue included $24.3 million of equipment sales for a specific project to one customer. Revenue from that project ended in the third quarter of fiscal year 2014.
In fiscal year 2014, consolidated revenue increased $63.3 million compared to fiscal year 2013. The IBW segment increased $12.2 million from increased sales of DAS products. The increased DAS product demand was driven by the trend for wireless voice and data traffic to move from the outdoor macro environment to indoors. The acquisition of CSI accounted for $3.7 million of revenue in fiscal year 2014. CSG segment revenue segment increased $51.1 million, primarily due to ISM products (the acquisition of Kentrox) which accounted for $46.2 million of the increase. The remaining increase resulted from sales of CSO products used to support the expansion of mobile networks, offset in part by declining demand for SONET/TDM products, which is older technology
|
| | | | | | | | | | | | | | | | | | | |
Gross profit and margin | Fiscal Year Ended March 31, | | Increase (Decrease) |
(in thousands) | 2015 | | 2014 | | 2013 | | 2015 vs.
2014 | | 2014 vs.
2013 |
IBW | $ | 13,715 |
| | $ | 4,161 |
| | $ | 391 |
| | $ | 9,554 |
| | $ | 3,770 |
|
| 36.4 | % | | 31.8 | % | | 43.3 | % | | 4.6 | % | | (11.5 | )% |
CSG | 13,095 |
| | 36,300 |
| | 12,225 |
| | (23,205 | ) | | 24,075 |
| 28.2 | % | | 40.8 | % | | 32.3 | % | | (12.6 | )% | | 8.5 | % |
Consolidated gross profit | $ | 26,810 |
| | $ | 40,461 |
| | $ | 12,616 |
| | $ | (13,651 | ) | | $ | 27,845 |
|
Consolidated gross margin | 31.9 | % | | 39.6 | % | | 32.5 | % | | (7.7 | )% | | 7.1 | % |
In fiscal year 2015, consolidated gross margin decreased 7.7% compared to fiscal year 2014. IBW segment gross margin increased 4.6% from increased sales of higher margin CSI products. CSG segment gross margin decreased 12.6% due to lower, high margin ISM product revenue noted above, lower overhead absorption resulting from lower revenue and increased excess and obsolete inventory expense of $1.3 million, resulting primarily from continued declining demand for SONET/TDM products.
In fiscal year 2014, consolidated gross margin increased 7.1% compared to fiscal year 2013. IBW segment gross margin decreased 11.5% due to product mix and $0.7 million of inventory valuation step-up resulting from the CSI acquisition purchase accounting fair value adjustment. CSG segment gross margin increased 8.5% due primarily to the mix of high margin ISM revenue noted above offset in part by a $1.5 million increase in excess and obsolete inventory from decreased demand for SONET/TDM products. In addition, gross margin was negatively impacted by the purchase accounting adjustments for the fair value related to the acquisition of Kentrox with revenue effectively reduced by $2.1 million to adjust the fair value the
performance obligation related to deferred revenue and the inclusion of inventory valuation step-up in cost of sales of $1.6 million.
|
| | | | | | | | | | | | | | | | | | | |
Sales and marketing (S&M) | Fiscal Year Ended March 31, | | Increase (Decrease) |
(in thousands) | 2015 | | 2014 | | 2013 | | 2015 vs.
2014 | | 2014 vs.
2013 |
Consolidated S&M expense | $ | 12,407 |
| | $ | 13,304 |
| | $ | 6,783 |
| | $ | (897 | ) | | $ | 6,521 |
|
Percentage of Revenue | 15 | % | | 13 | % | | 17 | % | | | | |
In fiscal year 2015, sales and marketing expense decreased $0.9 million compared to fiscal year 2014. The acquisition of CSI resulted in $3.2 million of additional sales and marketing expense but that was more than offset by a reduction of direct sales employees resulting in lower payroll and travel expense. In addition, sales commissions, which are earned on performance to targeted revenue, were lower.
In fiscal year 2014, sales and marketing expenses increased by $6.5 million compared to fiscal year 2013 due primarily to the acquisition of Kentrox, which added $6.4 million of expense. The CSI acquisition added $0.3 million of expense.
|
| | | | | | | | | | | | | | | | | | | |
Research and development (R&D) | Fiscal Year Ended March 31, | | Increase (Decrease) |
(in thousands) | 2015 | | 2014 | | 2013 | | 2015 vs.
2014 | | 2014 vs.
2013 |
IBW | $ | 8,955 |
| | $ | 1,360 |
| | $ | 305 |
| | $ | 7,595 |
| | $ | 1,055 |
|
CSG | 8,393 |
| | 9,979 |
| | 5,623 |
| | (1,586 | ) |
| 4,356 |
|
Consolidated R&D expense | $ | 17,348 |
|
| $ | 11,339 |
| | $ | 5,928 |
| | $ | 6,009 |
| | $ | 5,411 |
|
Percentage of Revenue | 21 | % | | 11 | % | | 15 | % | | | | |
In fiscal year 2015, consolidated research and development expense increased $6.0 million. IBW segment research and development expense increased $7.6 million which was the result of the CSI acquisition. CSG segment research and development expense decreased $1.6 million resulting from lower payroll expense due to less employees and lower bonus expense stemming from lower performance attainment.
In fiscal year 2014, consolidated research and development expense increased $5.4 million. IBW segment research and development expense increased $1.1 million resulting from the acquisition of CSI, which added $0.6 million of expense and increased spending on DAS product development before the CSI acquisition. CSG segment research and development expense increased $4.4 million primarily from the acquisition of Kentrox which added $3.8 million of expense. The remaining increase was due primarily to the Company's focus on Cell Site Optimization product development.
|
| | | | | | | | | | | | | | | | | | | |
General and administrative (G&A) | Fiscal Year Ended March 31, | | Increase (Decrease) |
(in thousands) | 2015 | | 2014 | | 2013 | | 2015 vs.
2014 | | 2014 vs.
2013 |
Consolidated G&A expense | $ | 14,678 |
| | $ | 14,027 |
| | $ | 9,310 |
| | $ | 651 |
| | $ | 4,717 |
|
Percentage of Revenue | 17 | % | | 14 | % | | 24 | % | | | | |
In fiscal year 2015, general and administrative expenses increased $0.7 million resulting primarily from the acquisition of CSI, which added $1.9 million of expense, and $2.1 million of expense related to the departure of the former CEO. This was offset, in part, by a $1.4 million reduction in bonus expense from lower performance attainment, $0.5 million of lower payroll expenses gained from operational efficiencies from the integration of the Kentrox acquisition, a $0.6 million reduction in professional services fees relating to acquisition services and retained employee search costs included in fiscal year 2014 and $0.3 million of lower fair value adjustments related to contingent consideration.
In fiscal year 2014, general and administrative expenses increased $4.7 million resulting primarily from the acquisition of Kentrox, which added $2.5 million of expense, the acquisition of CSI, which added $0.4 million of expense. In addition, there were increased compensation costs of $0.9 million, increased professional service fees of $0.3 million resulting from increases in audit and tax compliance and $0.3 million of expense related to the Antone contingent consideration time value of money.
|
| | | | | | | | | | | | | | | | | | | |
Restructuring | Fiscal Year Ended March 31, | | Increase (Decrease) |
(in thousands) | 2015 | | 2014 | | 2013 | | 2015 vs.
2014 | | 2014 vs.
2013 |
Consolidated restructuring expense | $ | 3,243 |
| | $ | 335 |
| | $ | 149 |
| | $ | 2,908 |
|
| $ | 186 |
|
In fiscal year 2015, the Company approved a plan to restructure its business, including reduction of headcount and consolidation of office space within the Aurora headquarters facility. These actions were taken in the fourth quarter of 2015, and the Company recorded a restructuring charge of $3.2 million, of which $2.7 million was for office space and $0.5 million was for employee severance payments and other costs.
In fiscal year 2014, the Company recorded restructuring charges related to termination awards for transitional employees associated with the Kentrox acquisition.
|
| | | | | | | | | | | | | | | | | | | |
Intangible amortization | Fiscal Year Ended March 31, | | Increase (Decrease) |
(in thousands) | 2015 | | 2014 | | 2013 | | 2015 vs.
2014 | | 2014 vs.
2013 |
Consolidated intangible amortization | $ | 6,377 |
| | $ | 4,889 |
| | $ | 887 |
| | $ | 1,488 |
| | $ | 4,002 |
|
The intangible assets consist of product technology, customer relationships, trade names, and backlog derived from acquisitions. The increase in fiscal year 2015 amortization compared to fiscal year 2014 was due primarily to the acquisition of CSI. The increase in fiscal year 2014 amortization compared to fiscal year 2013 was due primarily to the acquisition of Kentrox. In addition, an impairment charge of $0.1 million and $0.2 million was taken in fiscal years 2015 and 2014, respectively, for a product technology asset acquired in the acquisition of Noran Tel.
Goodwill impairment The Company recognized goodwill impairments of $32.0 million in fiscal year 2015 and $2.9 million in fiscal year 2013. Fiscal year 2015 triggering events including continued deterioration in macroeconomic conditions, decline in market capitalization, continued operating losses, lower forecasted revenue and cash flows, and the overall decline in the Company’s net sales, required the Company to test its goodwill for impairment. As a result of the goodwill impairment evaluations, a goodwill impairment charge of $11.5 million was taken for 100% of the goodwill in the CSG reporting unit and a charge of $20.5 million was taken for 100% of the goodwill in the IBW reporting unit. The goodwill impairment in fiscal year 2013 was the result of the Company's annual impairment testing and related to the former Westell reporting unit. No goodwill impairment was recorded in fiscal year 2014.
Other income (expense) Other income (expense), net was an expense of $2,000, and $0.1 million, and income of $0.2 million for fiscal years 2015, 2014, and 2013, respectively. Other income (expense), net contains interest income earned on short-term investments and foreign currency gains and losses. Year over year variations are primarily the result of foreign currency fluctuation.
Income tax (expense) benefit Income tax in fiscal year 2015 and 2014 was a benefit of $0.2 million and $7.9 million, respectively. The Company recorded income tax expense in fiscal year 2013 of $29.4 million.
In fiscal year 2015, the Company continues to maintain a full valuation allowance on deferred tax assets. The Company recorded an income tax benefit of $0.2 million that resulted from foreign tax and state tax based on gross margin
In fiscal year 2014, deferred tax liabilities of $8.3 million resulted from the acquisitions of Kentrox and CSI, relating primarily to acquired intangible assets. The Company's anticipated ability to realize deferred tax assets from the reversal of these deferred tax liabilities resulted in a reversal of valuation allowance. Income tax expense, excluding the impact of the acquisitions noted above, was $0.4 million primarily from state income tax expense in non-unitary states and state taxes based on gross margin, not taxable income.
In fiscal year 2013, the Company considered both the positive and negative evidence available to assess the realizability of its deferred tax assets. The Company considered negative factors which included recent losses and a forecasted three-year cumulative loss position, as well as positive evidence consisting primarily of projected future earnings. The Company concluded that the negative evidence outweighed the objectively verifiable positive evidence. As a result, the Company increased the valuation allowance against domestic deferred income tax assets by $34.0 million, which taken together with the liability for uncertain tax positions, had the effect of reserving in full all of the Company's deferred tax assets as of March 31, 2013.
Discontinued operations Net income from discontinued operations was $0.1 million in fiscal year 2015 and expense of $45,000 and $1.5 million in fiscal years 2014 and 2013, respectively.
The Company sold a portion of its former CNS segment and the entire ConferencePlus subsidiary in fiscal year 2012. The Company discontinued the operations of ConferencePlus at the time of the sale and discontinued the CNS segment operations in the first quarter of fiscal year 2014. The results of operations of CNS and ConferencePlus along with the gains on the sales have been classified as income from discontinued operations.
In fiscal year 2015, the income from discontinued operations resulted from release of a contingency reserve related to the sale of ConferencePlus. In fiscal year 2014, the loss from discontinued operations resulted from ongoing legal costs related to indemnity claims from the discontinued operations. In fiscal year 2013, the loss from discontinued operations resulted from a charge taken for an indemnification claim that related to the ConferencePlus sale transaction, partially offset by associated tax effects and unrelated discrete tax items.
Net income (loss) Net loss was $58.9 million and $44.0 million in fiscal years 2015 and 2013, respectively. Net income was $4.4 million in fiscal year 2014. The changes were due to the cumulative effects of the variances identified above.
Quarterly Results of Operations
The Company has experienced, and may continue to experience, fluctuations in quarterly results of operations. Such fluctuations in quarterly results may correspond to substantial fluctuations in the market price of the Class A Common Stock. Some factors which have had an influence on and may continue to influence the Company’s results of operations in a particular quarter include, but are not limited to, the size and timing of customer orders and subsequent shipments, customer order deferrals in anticipation of new products, timing of product introductions or enhancements by the Company or its competitors, market acceptance of new products, technological changes in the telecommunications industry, competitive pricing pressures, accuracy of customer forecasts of end-user demand, write-offs for excess or obsolete inventory, changes in the Company’s operating expenses, personnel changes, foreign currency fluctuations, changes in the mix of products sold, quality control of products sold, disruption in sources of supply, regulatory changes, capital spending, delays of payments by customers, working capital deficits and general economic conditions.
Sales to the Company’s customers typically involve long approval and procurement cycles and can involve large purchase commitments. Accordingly, cancellation or deferral of orders could cause significant fluctuations in the Company’s quarterly results of operations. As a result, the Company believes that period-to-period comparisons of its results of operations are not necessarily meaningful and caution should be used when placing reliance upon such comparisons as indications of future performance.
For a detailed comparison of the eight quarters ended March 31, 2015, see Note 17, Quarterly Results of Operations (Unaudited), in the Notes to the Consolidated Financial Statements.
Liquidity and Capital Resources
Overview
At March 31, 2015, the Company had $14.0 million in cash and cash equivalents and $23.9 million in short-term investments, consisting of bank deposits, money market funds, certificates of deposit and pre-refunded municipal bonds.
The Company believes that the existing sources of liquidity and cash from operations will satisfy cash flow requirements for the foreseeable future.
Cash Flows
The Consolidated Statements of Cash Flows include discontinued operations.
The Company’s operating activities used cash of $9.3 million and $12.1 million in fiscal years 2015 and 2013, respectively, and generated cash of $1.6 million in fiscal year 2014. Cash used in fiscal year 2015 resulted primarily from $58.9 million of net loss that includes $32.0 million of goodwill impairment, $10.0 million of depreciation, amortization and stock-based compensation expense, $3.2 million of restructuring and a $4.3 million increase in working capital. Cash provided in fiscal year 2014 resulted primarily from net income of $4.4 million that includes $7.4 million of depreciation, amortization and stock-based compensation expense, a $8.4 million increase in deferred tax assets and a $2.1 million decrease in working capital. Cash used in fiscal year 2013 resulted primarily from a net loss of $44.0 million that includes $5.7 million of depreciation, goodwill impairment, amortization and stock-based compensation expense, a $29.1 million decrease in deferred tax assets and a $3.8 million decrease in working capital.
The Company’s investing activities used cash of $10.8 million, $55.3 million and $7.8 million in fiscal years 2015, 2014, and 2013, respectively. In fiscal year 2015, the Company had net purchases of short-term investments of $8.3 million, used $2.1 million for the purchased of capital property and equipment and used $0.3 million for acquisitions. In fiscal year 2014, the Company had net sales of short-term investments of $8.8 million, used $0.4 million for the purchases of capital property and equipment, used $66.2 million for acquisitions and had a $2.5 million reduction of restricted cash. In fiscal year 2013, the Company used $9.9 million to purchase short-term investments and $0.4 million for the purchases of capital property and equipment, used $2.5 million for acquisitions and had an increase of $5.0 million of restricted cash.
The Company’s financing activities used cash of $1.7 million and $12.6 million in fiscal years 2015 and 2013, respectively, and generated cash of $1.3 million and in fiscal year 2014. The Company purchased $0.9 million, $0.4 million, and $12.7 million of its outstanding stock, which is recorded as treasury stock, and received proceeds from the exercise of stock options of $0.3 million, $1.7 million, and $0.1 million in fiscal years 2015, 2014 and 2013, respectively. The Company paid $1.1 million of contingent consideration in fiscal year 2015 related to the acquisition of ANTONE.
Purchase obligations consist of inventory that arises in the normal course of business operations. Future obligations and commitments as of March 31, 2015 consisted of the following:
|
| | | | | | | | | | | | | | | | | | | | | | | | | | | |
| Payments due by fiscal year |
(in thousands) | 2016 | | 2017 | | 2018 | | 2019 | | 2020 | | Thereafter | | Total |
Purchase obligations | $ | 9,030 |
| | $ | — |
| | $ | — |
| | $ | — |
| | $ | — |
| | $ | — |
| | $ | 9,030 |
|
Future minimum lease payments for operating leases | 2,638 |
| | 2,635 |
| | 1,023 |
| | 189 |
| | 58 |
| | — |
| | 6,543 |
|
Contingent consideration | $ | 1,184 |
| | $ | 400 |
| | $ | — |
| | $ | — |
| | $ | — |
| | $ | — |
| | $ | 1,584 |
|
Future obligations and commitments | $ | 12,852 |
| | $ | 3,035 |
| | $ | 1,023 |
| | $ | 189 |
| | $ | 58 |
| | $ | — |
| | $ | 17,157 |
|
As of March 31, 2015, the Company had net deferred tax assets of approximately $39.6 million before a valuation allowance of $39.7 million, resulting in a net deferred tax liability of $46,000. Also, as of March 31, 2015, the Company had a $3.0 million tax contingency reserve related to uncertain tax positions. Federal net operating loss carryforwards begin to expire in fiscal year 2023. Realization of deferred tax assets associated with the Company’s future deductible temporary differences, net operating loss carryforwards and tax credit carryforwards is dependent upon generating sufficient taxable income prior to their expiration, among other factors. The Company weighed positive and negative evidence to assess the need for a valuation allowance against deferred tax assets and whether a tax benefit should be recorded when taxable losses are incurred. The existence of a valuation allowance does not limit the availability of tax assets to reduce taxes payable when taxable income arises. Management periodically evaluates the recoverability of the deferred tax assets and may adjust the valuation allowance against deferred tax assets accordingly.
Off-Balance Sheet Arrangements
The Company has a 50% equity ownership in AccessTel Kentrox Australia PTY LTD (AKA). AKA distributes network management solutions provided by the Company and the other 50% owner to one customer. The Company holds equal voting control with the other owner. All actions of AKA are decided at the board level by majority vote. The Company also has an unlimited guarantee for the performance of the other 50% owner in AKA, who primarily provides support and engineering services to the customer. This guarantee was put in place at the request of the AKA customer. The guarantee which is estimated to have a maximum potential future payment of $0.7 million, will stay in place as long as the contract between AKA and the customer is in place. The Company would have recourse against the other 50% owner in AKA in the event the guarantee is triggered. The Company determined that it could perform on the obligation it guaranteed at a positive rate of return and therefore did not assign value to the guarantee.
ITEM 7A. QUANTITATIVE AND QUALITATIVE DISCLOSURES ABOUT MARKET RISK
The Company is subject to certain market risks, including foreign currency rate exposures and interest rates.
Foreign Currency Risk
The Company’s primary foreign currency exposure is to changes in exchange rates for the U.S. dollar versus the Canadian dollar and the Australian dollar and the related effects on receivables and payables denominated in those foreign currencies. On August 1, 2012, the functional currency for Noran Tel, the Company's foreign subsidiary located in Canada was changed from the Canadian dollar to the U.S. dollar. The Company continues to have revenue and expenses denominated in Canadian currency, but it is no longer exposed to gains and losses from fluctuations affecting net investments and earnings of Noran Tel. The Canadian entity revenues, which are denominated in U.S. dollars, are solely from its parent, Westell, Inc., located in the U.S.
The Company had approximately 2.1% and 0.6% of its revenue denominated in Australian and Canadian currencies, respectively, in the twelve months ended March 31, 2015. The Company estimates foreign currency market risk as the potential decrease in pretax earnings resulting from a hypothetical change in the ending exchange rate of 10%. If such change had occurred at March 31, 2015, the impact would have been an approximately $47,000 decrease in pretax earnings reported in the Company’s Consolidated Financial Statements. Although the Company’s supply contracts are denominated in U.S. dollars, changes in foreign currency rates, particularly for Asian currencies, may have indirect impacts on the Company’s costs.
Interest Rate and Default Risk
The Company has an investment portfolio consisting of bank deposits, money market funds, certificates of deposit and pre-refunded municipal bonds. These securities, like all fixed income instruments, may be subject to interest rate risk and default risk, and they will fall in value if market interest rates increase or if risks of default rise. Due to the short duration and conservative, high-quality nature of our investment portfolio, a movement of 10% by market interest rates would not have a material impact on our operating results and the total value of the portfolio.
ITEM 8. FINANCIAL STATEMENTS AND SUPPLEMENTARY DATA
The Company’s Consolidated Financial Statements required by Item 8, together with the reports thereon of the Independent Registered Public Accounting Firm are set forth on pages 33—77 of this report and are incorporated by reference in this Item 8. The Consolidated Financial Statement schedule listed under Item 15(a)(2), is set forth on page 79 of this report and is incorporated by referenced in this Item 8 and should be read in conjunction with the financial statements.
ITEM 9. CHANGES IN AND DISAGREEMENTS WITH ACCOUNTANTS ON ACCOUNTING AND FINANCIAL DISCLOSURE
None.
|
| |
ITEM 9A. | CONTROLS AND PROCEDURES |
Evaluation of Disclosure Controls and Procedures
Under the supervision and with the participation of the Company’s senior management, including the Company’s Chief Executive Officer and Chief Financial Officer, the Company conducted an evaluation of the effectiveness of the design and operation of the Company’s disclosure controls and procedures, as defined in Rules 13a-15(e) and 15d-15(e) under the Securities Exchange Act of 1934, as amended (the Exchange Act), as of the end of the period covered by this annual report (the Evaluation Date). Based upon this evaluation, the Company’s Chief Executive Officer and Chief Financial Officer concluded as of the Evaluation Date that the Company’s disclosure controls and procedures were effective such that the information relating to the Company, including consolidated subsidiaries, required to be disclosed in the Company’s Securities and Exchange Commission (SEC) reports (i) is recorded, processed, summarized and reported within the time periods specified in SEC rules and forms, and (ii) is accumulated and communicated to the Company’s management, including the Company’s Chief Executive Officer and Chief Financial Officer, as appropriate to allow timely decisions regarding required disclosure.
Management’s Report on Internal Control Over Financial Reporting
Management is responsible for establishing and maintaining adequate internal control over financial reporting, as such term is defined in Exchange Act Rules 13a-15(f) and 15d-15(f). There are inherent limitations to the effectiveness of any system of internal control over financial reporting, including the possibility of human error and the circumvention or overriding of the controls and procedures. Accordingly, even an effective system of internal control over financial reporting can provide only reasonable assurance with respect to financial statement preparation and presentation in accordance with generally accepted accounting principles. Also, projections of any evaluation of effectiveness to future periods are subject to risk that controls may become inadequate because of changes in conditions, or that the degree of compliance with the policies or procedures may deteriorate.
Management, with participation of the Company’s Chief Executive Officer and Chief Financial Officer, assessed the effectiveness of the Company’s internal control over financial reporting as of March 31, 2015, based on criteria established in the Internal Control-Integrated Framework (2013) issued by the Committee of Sponsoring Organizations of the Treadway Commission (COSO) and concluded that, in spite of the restatement which was caused by a previously unidentified pre-acquisition liability, the Company’s internal control over financial reporting was effective as of March 31, 2015. The Company's controls effectively detected the pre-acquisition error at the first opportunity following the acquisition for the control to function.
The Company’s Independent Registered Public Accounting Firm has issued an audit opinion on its assessment of the Company’s internal control over financial reporting as of March 31, 2015. This report is included on page 35.
Changes in Internal Control Over Financial Reporting
There have been no changes except as noted below in the Company’s internal control over financial reporting that occurred during the three months ended March 31, 2015, that have materially affected or are reasonably likely to materially affect the Company’s internal control over financial reporting. The Company acquired Cellular Specialties, Inc. (CSI) on March 1, 2014, and during the time between the acquisition and the third quarter of fiscal year 2015 the Company implemented specific transitional controls for the acquired business. The Company completed integration of CSI into the existing system of internal control over financial reporting during the fourth quarter of fiscal 2015.
|
| |
ITEM 9B. | OTHER INFORMATION |
None.
PART III
|
| |
ITEM 10. | DIRECTORS, EXECUTIVE OFFICERS AND CORPORATE GOVERNANCE |
(a) Directors of the Company
The information required by this Item is set forth in the Company’s Proxy Statement for the Annual Meeting of Stockholders to be held in September 2015 under the captions “Election of Directors,” “Corporate Governance – Board Committees,” and “Section 16(a). Beneficial Ownership Reporting Compliance,” which information is incorporated herein by reference.
(b) Executive Officers of the Company
The information required by this Item is set forth in the Company’s Proxy Statement for the Annual Meeting of Stockholders to be held in September 2015 under the caption “Corporate Governance—Executive Officers,” which information is incorporated herein by reference.
Code of Business Conduct
We have adopted a Code of Business Conduct within the meaning of Item 406(b) of Regulation S-K. This Code of Business Conduct applies to all of our directors, officers (including the principal executive officer, principal financial officer, principal accounting officer and any person performing similar functions) and employees. This Code of Business Conduct is publicly available in the corporate governance section on our website at http://www.westell.com. The Company intends to satisfy the disclosure requirement under Item 5.05 of Form 8-K by posting on its website any amendments to, or waivers from, its Code of Business Conduct applicable to our principal executive officer, principal financial officer, principal accounting officer and any person performing similar functions. Copies of the Code of Business Conduct will be provided free of charge upon written request directed to the Secretary of the Company at the address of the principal executive offices.
|
| |
ITEM 11. | EXECUTIVE COMPENSATION |
The information required by this Item is set forth in the Company’s Proxy Statement for the Annual Meeting of Stockholders to be held in September 2015 under the captions “Compensation Discussion and Analysis,” “Compensation Committee Interlocks and Insider Participation,” “Compensation Committee Report on Executive Compensation,” “Summary Compensation Table,” “Grants of Plan-Based Awards,” “Outstanding Equity Awards at Fiscal Year-End,” “Option Exercises and Stock Vested,” “Potential Payments Upon Termination or Change in Control,” and “Director Compensation,” which information is incorporated herein by reference.
|
| |
ITEM 12. | SECURITY OWNERSHIP OF CERTAIN BENEFICIAL OWNERS AND MANAGEMENT AND RELATED STOCKHOLDER MATTERS |
The information required by this Item is set forth in the Company’s Proxy Statement for the Annual Meeting of Stockholders to be held in September 2015 under the captions “Ownership of the Capital Stock of the Company,” and “Equity Compensation Plan Information,” which information is incorporated herein by reference.
|
| |
ITEM 13. | CERTAIN RELATIONSHIPS AND RELATED TRANSACTIONS, AND DIRECTOR INDEPENDENCE |
The information required by this Item is set forth in the Company’s Proxy Statement for the Annual Meeting of Stockholders to be held in September 2015 under the caption “Certain Relationships and Related Party Transactions,” and “Corporate Governance – Director Independence,” which information is incorporated herein by reference.
|
| |
ITEM 14. | PRINCIPAL ACCOUNTANT FEES AND SERVICES |
The information required by this item is incorporated herein by reference to the sections entitled “Fees to the Company’s Auditors” and “Approval of Services Provided by Independent Registered Public Accounting Firm” in the Company’s Proxy Statement for the Annual Meeting of Stockholders to be held in September 2015.
PART IV
|
| |
ITEM 15. | EXHIBITS AND FINANCIAL STATEMENT SCHEDULES |
(a)(1) Financial Statements
The following documents are filed as part of this report:
The Consolidated Financial Statements of Westell Technologies, Inc. at March 31, 2015, and 2014, and for each of the three fiscal years in the period ended March 31, 2015, together with the Reports of Independent Registered Public Accounting Firm, are set forth on page 33 through 77 of this Report.
The supplemental financial information listed and appearing hereafter should be read in conjunction with the Consolidated Financial Statements included in the report.
(2) Financial Statement Schedules
The following are included in Part IV of this Report for each of the years ended March 31, 2015, 2014, and 2013, as applicable:
Schedule II - Valuation and Qualifying Accounts - page 79
Financial statement schedules not included in this report have been omitted either because they are not applicable or because the required information is shown in the Consolidated Financial Statements or notes thereto, included in this report.
(3) Exhibits
|
| | |
| | |
Exhibit Number | | Document Description |
| |
2.1 | | Asset Purchase Agreement dated as of March 17, 2011, by and between Westell Technologies, Inc., Westell, Inc., NETGEAR, Inc., and NETGEAR Ltd. (incorporated herein by reference to Exhibit 2.1 to the Company's Form 8-K filed on March 18, 2011). |
| | |
2.2 | | Stock Purchase Agreement, dated December 20, 2011, among Arkadin S.A.S, Arkadin, Inc. and Westell Technologies, Inc. (incorporated herein by reference to Exhibit 2.1 to the Company's Current Report on Form 8-K filed on December 21, 2011). |
| | |
2.3 | | Agreement and Plan of Merger, dated as of March 15, 2013, by and among Westell, Inc., Wes Acquisition Sub, Inc., Kentrox, Inc., and Investcorp Technology Ventures II, L.P. (incorporated by reference to Exhibit 2.1 to the Westell Technologies, Inc. Form 8-K filed on March 18, 2013). |
| | |
2.4 | | Stock Purchase Agreement, dated as of March 1, 2014, by and among Westell, Inc., Cellular Specialties, Inc., the shareholders of Cellular Specialties, Inc., Scott T. Goodrich and R. Bruce Wilson, in their capacity as the sellers’ representative and each of Scott T. Goodrich, Fred N.S. Goodrich, Kelley Carr, and R. Bruce Wilson (incorporated by reference to Exhibit 2.1 to the Westell Technologies, Inc. Form 8-K filed on March 3, 2014). |
| | |
3.1 | | Amended and Restated Certificate of Incorporation, as amended (incorporated herein by reference to Exhibit 3.1 to the Company's Quarterly Report on Form 10-Q for the quarter ended June 30, 2005). |
| |
3.2 | | Amended and Restated By-laws (incorporated herein by reference to Exhibit 3.1 to the Company's Form 8-K filed on December 18, 2009). |
| |
9.1 | | Voting Trust Agreement dated February 23, 1994, as amended (incorporated herein by reference to Exhibit 9.1 to the Company's Registration Statement on Form S-1, as amended, Registration No. 33-98024). |
| | |
9.1(a) | | Third Amendment to Voting Trust Agreement, dated as of April 30, 2015 (incorporated herein by reference to Exhibit 1 to Amendment No. 16 to Schedule 13D filed by Robert C. Penny III, Robert W. Foskett and Patrick J. McDonough, Jr. filed on May 5, 2015).
|
| | |
|
| | |
| |
10.1 | | Stock Transfer Restriction Agreement entered into by members of the Penny family, as amended (incorporated herein by reference to Exhibits 10.4 and 10.16 to the Company's Registration Statement on Form S-1, as amended, Registration No. 33-98024). |
| | |
10.2 | | Form of Registration Rights Agreement among Westell Technologies, Inc. and trustees of the Voting Trust dated February 23, 1994 (incorporated herein by reference to Exhibit 10.5 to the Company's Registration Statement on Form S-1, as amended, Registration No. 33-98024). |
| | |
*10.3 | | 1995 Stock Incentive Plan (incorporated herein by reference to Exhibit 10.6 to the Company's Registration Statement on Form S-1, as amended, Registration No. 33-98024). |
| | |
*10.4 | | Offer letter for Charles S. Bernstein (incorporated herein by reference to Exhibit 10.4 to the Company's Annual Report on Form 10-K for the year ended March 31, 2015 filed on May 22, 2015). |
| |
10.5 | | Lease dated September 29, 1997, between WTI (IL) QRS 12-36, Inc., and Westell, Inc. (incorporated herein by reference to Exhibit 99.3 to the Company's Form 8-K filed on October 2, 1997). |
| |
10.6 | | Settlement Agreement dated November 30, 2002, with respect to the lease dated September 29, 1997 (incorporated herein by reference to Exhibit 10.12 to the Company's Annual Report on Form 10-K for the year ended March 31, 2008). |
| |
*10.7 | | Form of Indemnification Agreement for Directors and Officers of the Company (incorporated herein by reference to Exhibit 10.1 to the Company's Quarterly Report on Form 10-Q for the quarter ended September 30, 2010). |
| |
*10.8 | | Westell Technologies, Inc. 2004 Stock Incentive Plan, as amended and restated as of June 29, 2010 (incorporated herein by reference to Annex A to the Company's Proxy Statement for the 2010 Annual Meeting of Stockholders filed on July 29, 2010). |
| |
*10.9(a) | | Form of Restricted Stock Unit Award for awards granted on or prior to April 4, 2011, under the Westell Technologies, Inc. 2004 Stock Incentive Plan (incorporated herein by reference to Exhibit 10.10 to the Company's Annual Report on Form 10-K for the year ended March 31, 2010). |
| |
*10.9(b) | | Form of Restricted Stock Unit Award Agreement for awards granted to Richard S. Gilbert on April 4, 2011 under the Westell Technologies, Inc. 2004 Stock Incentive Plan (incorporated herein by reference to Exhibit 10.1 to the Company's Form 8-K filed on April 6, 2011). |
| |
*10.9(c) | | Form of Restricted Stock Unit Award Agreement for awards granted subsequent to April 4, 2011, under the Westell Technologies, Inc. 2004 Stock Incentive Plan (incorporated by reference to Exhibit 10.10(c) to the Company's Annual Report on Form 10-K for the year ended March 31, 2012). |
| |
*10.10 | | Form of Non-Qualified Stock Option Award under the Westell Technologies, Inc. 2004 Stock Incentive Plan (incorporated herein by reference to Exhibit 10.4 to the Company's Quarterly Report on Form 10-Q for the quarter ended December 31, 2008). |
| | |
*10.11 | | Severance agreement for Amy T. Forster (incorporated herein by reference to Exhibit 10.6 to the Company's Quarterly Report on Form 10-Q filed for the quarter ended June 30, 2013). |
| | |
*10.12 | | Form of Performance Stock Unit Award Agreement for awards granted subsequent to March 31, 2013 under the Westell Technologies, Inc. 2004 Stock Incentive Plan (incorporated herein by reference to Exhibit 10.2 to the Company's Form 8-K filed on March 28, 2014). |
| |
*10.13 | | Form of Incentive Stock Option Award under the Westell Technologies, Inc. 2004 Stock Incentive Plan (incorporated herein by reference to Exhibit 10.22 to the Company's Annual Report on Form 10-K for the year ended March 31, 2010). |
| | |
*10.14 | | Employment Agreement, dated January 18, 2011, by and among Westell Technologies, Inc., Westell, Inc. and Richard S. Gilbert (incorporated herein by reference to Exhibit 10.1 to the Company's Form 8-K filed on January 19, 2011). |
| |
*10.15 | | Westell Technologies, Inc. Incentive Compensation Plan (incorporated herein by reference to Annex B to the Company's Proxy Statement for the 2010 Annual Meeting of Stockholders filed on July 29, 2010). |
| |
|
| | |
*10.16 | | Summary of Director Compensation (incorporated herein by reference to Exhibit 10.16 to the Company's Annual Report on Form 10-K for the year ended March 31, 2015 filed on May 22, 2015). |
| |
*10.17 | | Form of Non-Employee Director Restricted Stock Award under the 2004 Stock Incentive Plan for awards granted prior to April 2010 (incorporated herein by reference to Exhibit 10.20 to the Company’s Annual Report on Form 10-K for the year ended March 31, 2010). |
| |
*10.18 | | Form of Non-Employee Director Restricted Stock Award under the 2004 Stock Incentive Plan for awards granted on or after April 1, 2010 (incorporated herein by reference to Exhibit 10.21 to the Company’s Annual Report on Form 10-K for the year ended March 31, 2010). |
| | |
*10.19 | | Form of Non-Qualified Stock Option Award granted subsequent to May 2010 under the Westell Technologies, Inc. 2004 Stock Incentive Plan (incorporated herein by reference to Exhibit 10.1 to the Company's Form 8-K filed on June 18, 2013). |
| | |
*10.20 | | Form of Performance Stock Unit Award Agreement for awards granted in fiscal year 2014 under the Westell Technologies, Inc. 2004 Stock Incentive Plan (incorporated herein by reference to Exhibit 10.2 to the Company's Form 8-K filed on June 18, 2013). |
| | |
*10.21 | | Offer letter for Richard S. Cremona (incorporated herein by reference to Exhibit 10.1 to the Company's Form 8-K filed on June 26, 2013). |
| | |
*10.22 | | Employment agreement for Thomas P. Minichiello (incorporated herein by reference to Exhibit 10.1 to the Company's Form 8-K filed on June 28, 2013). |
| | |
*10.23 | | Offer letter for Benjamin S. Stump (incorporated herein by reference to Exhibit 10.5 to the Company's Quarterly Report on Form 10-Q filed for the quarter ended June 30, 2013). |
| | |
*10.24 | | Offer letter for Scott T. Goodrich (incorporated herein by reference to Exhibit 10.25 to the Company’s Annual Report on Form 10-K for the year ended March 31, 2014). |
| |
*10.25 | | Offer letter for Mark Skurla (incorporated herein by reference to Exhibit 10.2 to the Company's Quarterly Report on Form 10-Q filed for the quarter ended October 31, 2014). |
| | |
*10.26 | | Form of Non-Employee Director Restricted Stock Award (as amended) (incorporated herein by reference to Exhibit 10.1 to the Company's Quarterly Report on Form 10-Q filed for the quarter ended October 31, 2014). |
| | |
*10.27 | | Offer Letter for J. Thomas Gruenwald (incorporated herein by reference to Exhibit 10.1 to the Company's Form 8-K filed on February 11, 2015). |
| | |
*10.28 | | Form of Stock Option Award Agreement for award granted to J. Thomas Gruenwald on February 10, 2015 (incorporated herein by reference to Exhibit 10.28 to the Company's Annual Report on Form 10-K for the year ended March 31, 2015 filed on May 22, 2015). |
| | |
*10.29 | | Form of Restricted Stock Unit Award Agreement for award granted to J. Thomas Gruenwald on February 10, 2015 (incorporated herein by reference to Exhibit 10.29 to the Company's Annual Report on Form 10-K for the year ended March 31, 2015 filed on May 22, 2015). |
| | |
18.1 | | Preference letter regarding change in accounting principle (incorporated herein by reference to Exhibit 18 to the Company's Form 10-Q filed on August 1, 2014). |
| | |
21.1 | | Subsidiaries of the Registrant (incorporated herein by reference to Exhibit 21.1 to the Company's Annual Report on Form 10-K for the year ended March 31, 2015 filed on May 22, 2015). |
| |
23.1 | | Consent of Independent Registered Public Accounting Firm. |
| |
31.1 | | Certification of the Chief Executive Officer pursuant to Section 302 of Sarbanes-Oxley Act of 2002. |
| |
31.2 | | Certification of the Chief Financial Officer pursuant to Section 302 of Sarbanes-Oxley Act of 2002. |
| |
32.1 | | Certification of the Chief Executive Officer and Chief Financial Officer pursuant to Section 906 of Sarbanes-Oxley Act of 2002. |
| |
|
| | |
101 | | The following financial information from the Annual Report on Form 10-K/A for the year ended March 31, 2015, formatted in XBRL (eXtensible Business Reporting Language): (i) the Consolidated Balance Sheets; (ii) the Consolidated Statements of Operations; (iii) the Consolidated Statements of Comprehensive Income (Loss); (iv) the Consolidated Statements of Stockholders’ Equity; (v) the Consolidated Statements of Cash Flows; and (vi) the Notes to the Consolidated Financial Statements. |
|
| |
* | Management contract or compensatory plan or arrangement. |
(b) Exhibits
The exhibits filed as part of this Annual Report on Form 10-K/A are as specified in Item 15(a)(3) herein.
(c) Financial Statement Schedule
The financial statement schedule filed as part of this Annual Report on Form 10-K/A is as specified in Item 15(a)(2) herein.
SIGNATURES
Pursuant to the requirements of Section 13 or 15(d) of the Securities Exchange Act of 1934, the registrant has duly caused this report to be signed on its behalf by the undersigned, thereunto duly authorized on November 9, 2015.
|
| | |
| | |
WESTELL TECHNOLOGIES, INC. |
| |
By | | /s/ J. Thomas Gruenwald |
| | J. Thomas Gruenwald |
| | President and Chief Executive Officer |
INDEX TO CONSOLIDATED FINANCIAL STATEMENTS
AND SUPPLEMENTARY DATA
Report of Independent Registered Public Accounting Firm
The Board of Directors and Stockholders of
Westell Technologies, Inc. and Subsidiaries
We have audited the accompanying consolidated balance sheets of Westell Technologies, Inc. and Subsidiaries (the Company) as of March 31, 2015 and 2014, and the related consolidated statements of operations, comprehensive income (loss), stockholders’ equity, and cash flows for each of the three years in the period ended March 31, 2015. Our audits also included the financial statement schedule listed in the Index at Item 15(a)(2). These financial statements and schedule are the responsibility of the Company’s management. Our responsibility is to express an opinion on these financial statements and schedule based on our audits.
We conducted our audits in accordance with the standards of the Public Company Accounting Oversight Board (United States). Those standards require that we plan and perform the audit to obtain reasonable assurance about whether the financial statements are free of material misstatement. An audit includes examining, on a test basis, evidence supporting the amounts and disclosures in the financial statements. An audit also includes assessing the accounting principles used and significant estimates made by management, as well as evaluating the overall financial statement presentation. We believe that our audits provide a reasonable basis for our opinion.
In our opinion, the financial statements referred to above present fairly, in all material respects, the consolidated financial position of Westell Technologies, Inc. and Subsidiaries at March 31, 2015 and 2014, and the consolidated results of its operations and its cash flows for each of the three years in the period ended March 31, 2015, in conformity with U.S. generally accepted accounting principles. Also, in our opinion, the related financial statement schedule, when considered in relation to the basic financial statements taken as a whole, presents fairly, in all material respects, the information set forth therein.
As discussed in Note 1 to the consolidated financial statements, the 2015 and 2014 financial statements and the financial statement schedule listed in the Index at Item 15(a)(2) have been restated to account for an unrecorded liability, an error in goodwill impairment, and an error in deferred taxes.
We also have audited, in accordance with the standards of the Public Company Accounting Oversight Board (United States), Westell Technologies, Inc. and Subsidiaries’ internal control over financial reporting as of March 31, 2015, based on criteria established in Internal Control - Integrated Framework issued by the Committee of Sponsoring Organizations of the Treadway Commission (2013 framework), and our report dated May 22, 2015, except for the internal control over financial reporting related to the restatement in Note 1 of the 2015 consolidated financial statements as to which the date is November 9, 2015, expressed an unqualified opinion thereon.
/s/ Ernst & Young LLP
Chicago, Illinois
May 22, 2015, except to Note 1 of the consolidated financial statements, as to which the date is November 9, 2015.
Report of Independent Registered Public Accounting Firm
The Board of Directors and Stockholders of
Westell Technologies, Inc. and Subsidiaries
We have audited Westell Technologies, Inc. and Subsidiaries’ internal control over financial reporting as of March 31, 2015, based on criteria established in Internal Control - Integrated Framework issued by the Committee of Sponsoring Organizations of the Treadway Commission (2013 framework) (the COSO criteria). Westell Technologies, Inc. and Subsidiaries’ management is responsible for maintaining effective internal control over financial reporting, and for its assessment of the effectiveness of internal control over financial reporting included in the accompanying Report of Management on Internal Control Over Financial Reporting. Our responsibility is to express an opinion on the company’s internal control over financial reporting based on our audit.
We conducted our audit in accordance with the standards of the Public Company Accounting Oversight Board (United States). Those standards require that we plan and perform the audit to obtain reasonable assurance about whether effective internal control over financial reporting was maintained in all material respects. Our audit included obtaining an understanding of internal control over financial reporting, assessing the risk that a material weakness exists, testing and evaluating the design and operating effectiveness of internal control based on the assessed risk, and performing such other procedures as we considered necessary in the circumstances. We believe that our audit provides a reasonable basis for our opinion.
A company’s internal control over financial reporting is a process designed to provide reasonable assurance regarding the reliability of financial reporting and the preparation of financial statements for external purposes in accordance with generally accepted accounting principles. A company’s internal control over financial reporting includes those policies and procedures that (1) pertain to the maintenance of records that, in reasonable detail, accurately and fairly reflect the transactions and dispositions of the assets of the company; (2) provide reasonable assurance that transactions are recorded as necessary to permit preparation of financial statements in accordance with generally accepted accounting principles, and that receipts and expenditures of the company are being made only in accordance with authorizations of management and directors of the company; and (3) provide reasonable assurance regarding prevention or timely detection of unauthorized acquisition, use, or disposition of the company’s assets that could have a material effect on the financial statements.
Because of its inherent limitations, internal control over financial reporting may not prevent or detect misstatements. Also, projections of any evaluation of effectiveness to future periods are subject to the risk that controls may become inadequate because of changes in conditions, or that the degree of compliance with the policies or procedures may deteriorate.
In our opinion, Westell Technologies, Inc. and Subsidiaries maintained, in all material respects, effective internal control over financial reporting as of March 31, 2015, based on the COSO criteria.
We also have audited, in accordance with the standards of the Public Company Accounting Oversight Board (United States), the consolidated balance sheets of Westell Technologies, Inc. and Subsidiaries as of March 31, 2015 and 2014, and the related consolidated statements of operations, comprehensive income (loss), stockholders’ equity, and cash flows for each of the three years in the period ended March 31, 2015, and our report dated May 22, 2015, except for the internal control over financial reporting related to the restatement in Note 1 of the 2015 consolidated financial statements as to which the date is November 9, 2015, expressed an unqualified opinion thereon.
/s/ Ernst & Young LLP
Chicago, Illinois
May 22, 2015, except for internal control over financial reporting related to Note 1 of the consolidated financial statements as to which the date is November 9, 2015.
WESTELL TECHNOLOGIES, INC. AND SUBSIDIARIES
CONSOLIDATED BALANCE SHEET |
| | | | | | | |
(In thousands, except share amounts) | March 31, 2015 (as restated (1)) | | March 31, 2014(as restated and adjusted (1) (2)) |
Assets | | | |
Current assets: | | | |
Cash and cash equivalents | $ | 14,026 |
| | $ | 35,793 |
|
Short-term investments | 23,906 |
| | 15,584 |
|
Accounts receivable (net of allowance of $408 and $82 as of March 31, 2015 and 2014, respectively) | 11,845 |
| | 15,831 |
|
Inventories | 16,205 |
| | 24,056 |
|
Prepaid expenses and other current assets | 3,285 |
| | 1,952 |
|
Deferred income tax assets | 1,043 |
| | 1,449 |
|
Land held-for-sale | 264 |
| | 264 |
|
Total current assets | 70,574 |
| | 94,929 |
|
Land, Property and equipment: | | | |
Land | 672 |
| | 780 |
|
Machinery and equipment | 1,701 |
| | 1,413 |
|
Office, computer and research equipment | 6,260 |
| | 9,039 |
|
Leasehold improvements | 7,451 |
| | 7,450 |
|
Total property and equipment, gross | 16,084 |
| | 18,682 |
|
Less accumulated depreciation and amortization | (12,481 | ) | | (16,001 | ) |
Property and equipment, net | 3,603 |
| | 2,681 |
|
Goodwill | — |
| | 31,997 |
|
Other intangible assets, net | 25,942 |
| | 32,319 |
|
Other non-current assets | 258 |
| | 393 |
|
Total assets | $ | 100,377 |
| | $ | 162,319 |
|
Liabilities and Stockholders’ Equity | | | |
Current liabilities: | | | |
Accounts payable | $ | 4,011 |
| | $ | 7,508 |
|
Accrued expenses | 4,602 |
| | 4,365 |
|
Accrued restructuring | 1,161 |
| | 57 |
|
Accrued compensation | 974 |
| | 4,395 |
|
Contingent consideration | 1,184 |
| | 2,067 |
|
Deferred revenue | 2,415 |
| | 1,774 |
|
Total current liabilities | 14,347 |
| | 20,166 |
|
Deferred revenue non-current | 751 |
| | 787 |
|
Deferred income tax liability | 1,089 |
| | 1,622 |
|
Accrued restructuring non-current | 1,642 |
| | — |
|
Contingent consideration non-current | 400 |
| | 574 |
|
Other non-current liabilities | 409 |
| | 528 |
|
Total liabilities | 18,638 |
| | 23,677 |
|
Commitments and contingencies (see Notes 2 and 6) |
|
| |
|
|
Stockholders’ equity: | | | |
Class A common stock, par $0.01, Authorized – 109,000,000 shares
Outstanding – 46,839,361 and 45,852,740 shares at March 31, 2015 and 2014, respectively | 468 |
| | 459 |
|
Class B common stock, par $0.01, Authorized – 25,000,000 shares
Issued and outstanding – 13,937,151 shares at both March 31, 2015 and 2014 | 139 |
| | 139 |
|
Preferred stock, par $0.01, Authorized – 1,000,000 shares Issued and outstanding – none | — |
| | — |
|
Additional paid-in capital | 413,026 |
| | 410,176 |
|
Treasury stock at cost – 17,466,855 and 17,130,965 shares at March 31, 2015 and 2014, respectively | (35,066 | ) | | (34,206 | ) |
Cumulative translation adjustment | 608 |
| | 608 |
|
Accumulated deficit | (297,436 | ) | | (238,534 | ) |
Total stockholders’ equity | 81,739 |
| | 138,642 |
|
Total liabilities and stockholders’ equity | $ | 100,377 |
| | $ | 162,319 |
|
(1) See Note 1 for restatement information.
(2) Certain amounts have been adjusted to reflect measurement period adjustments related to the CSI acquisition (see Note 2).
The accompanying notes are an integral part of these Consolidated Financial Statements.
WESTELL TECHNOLOGIES, INC. AND SUBSIDIARIES
CONSOLIDATED STATEMENTS OF OPERATIONS
|
| | | | | | | | | | | |
(In thousands, except per share amounts) | Fiscal Year Ended March 31, |
| 2015 (as restated(1)) | | 2014 (as restated(1)(2) (3)) | | 2013 (as adjusted (2)) |
Revenue | $ | 84,127 |
| | $ | 102,073 |
| | $ | 38,808 |
|
Cost of revenue | 57,317 |
| | 61,612 |
| | 26,192 |
|
Gross profit | 26,810 |
| | 40,461 |
| | 12,616 |
|
Operating expenses: | | | | | |
Sales and marketing | 12,407 |
| | 13,304 |
| | 6,783 |
|
Research and development | 17,348 |
| | 11,339 |
| | 5,928 |
|
General and administrative | 14,678 |
| | 14,027 |
| | 9,310 |
|
Intangible amortization | 6,377 |
| | 4,889 |
| | 887 |
|
Restructuring | 3,243 |
| | 335 |
| | 149 |
|
Goodwill impairment | 31,997 |
| | — |
| | 2,884 |
|
Total operating expenses | 86,050 |
| | 43,894 |
| | 25,941 |
|
Operating loss from continuing operations | (59,240 | ) | | (3,433 | ) | | (13,325 | ) |
Other income (expense), net | (2 | ) | | (56 | ) | | 175 |
|
Loss before income taxes and discontinued operations | (59,242 | ) | | (3,489 | ) | | (13,150 | ) |
Income tax (expense) benefit | 201 |
| | 7,910 |
| | (29,392 | ) |
Net income (loss) from continuing operations | (59,041 | ) | | 4,421 |
| | (42,542 | ) |
Discontinued operations (Note 1): | | | | | |
Income (loss) from discontinued operations, net of tax benefit (expense) of $(88), $0 and $813 for fiscal years 2015, 2014 and 2013, respectively | 139 |
| | (45 | ) | | (1,496 | ) |
Net income (loss) | $ | (58,902 | ) | | $ | 4,376 |
| | $ | (44,038 | ) |
Basic net income (loss) per share: | | | | | |
Basic net income (loss) from continuing operations | $ | (0.98 | ) | | $ | 0.08 |
| | $ | (0.71 | ) |
Basic net income (loss) from discontinued operations | — |
| | — |
| | (0.02 | ) |
Basic net income (loss) per share (4) | $ | (0.98 | ) | | $ | 0.07 |
| | $ | (0.73 | ) |
Diluted net income (loss) per share: | | | | | |
Diluted net income (loss) from continuing operations | $ | (0.98 | ) | | $ | 0.07 |
| | $ | (0.71 | ) |
Diluted net income (loss) from discontinued operations | — |
| | — |
| | (0.02 | ) |
Diluted net income (loss) per share | $ | (0.98 | ) | | $ | 0.07 |
| | $ | (0.73 | ) |
Weighted-average number of shares outstanding: | | | | | |
Basic | 59,985 |
| | 58,786 |
| | 59,944 |
|
Effect of dilutive securities: restricted stock, restricted stock units, performance stock units and stock options(5) | — |
| | 1,262 |
| | — |
|
Diluted | 59,985 |
| | 60,048 |
| | 59,944 |
|
(2) Certain amounts have been reclassified to reflect a change in accounting principle (see Note 1).
(3) Certain amounts have been adjusted to reflect measurement period adjustments related to the CSI acquisition (see Note 2).
(4) Sums may not total due to rounding.
(5) The Company had 0.6 million shares represented by options for the twelve months ended March 31, 2014, which were not included in the computation of average dilutive shares outstanding because they were anti-dilutive. In periods with a net loss from continuing operations, the basic loss per share equals the diluted loss per share as all common stock equivalents are excluded from the per share calculation.
The accompanying notes are an integral part of these Consolidated Financial Statements.
WESTELL TECHNOLOGIES, INC. AND SUBSIDIARIES
CONSOLIDATED STATEMENTS OF COMPREHENSIVE INCOME (LOSS)
|
| | | | | | | | | | | |
(In thousands) | Fiscal Year Ended March 31, |
| 2015 (as restated (1)) | | 2014 (as restated (1)(2)) | | 2013 |
Net income (loss) | $ | (58,902 | ) | | $ | 4,376 |
| | $ | (44,038 | ) |
Other comprehensive income (loss): | | | | | |
Foreign currency translation adjustment | — |
| | — |
| | (11 | ) |
Total other comprehensive income (loss) | — |
| | — |
| | (11 | ) |
Total comprehensive income (loss) | $ | (58,902 | ) | | $ | 4,376 |
| | $ | (44,049 | ) |
(1) See Note 1 for restatement information.
(2) Certain amounts have been adjusted to reflect measurement period adjustments related to the CSI acquisition (see Note 2).
The accompanying notes are an integral part of these Consolidated Financial Statements.
WESTELL TECHNOLOGIES, INC. AND SUBSIDIARIES
CONSOLIDATED STATEMENTS OF STOCKHOLDERS’ EQUITY
|
| | | | | | | | | | | | | | | | | | | | | | | | | | | |
(In thousands) | Common Stock Class A | | Common Stock Class B | | Additional Paid-in Capital | | Accumulated Translation Adjustment | | Accumulated Deficit (as restated (1)) | | Treasury Stock | | Total Stockholders’ Equity (as restated (1)) |
Balance, March 31, 2012 | $ | 504 |
| | $ | 139 |
| | $ | 405,147 |
| | $ | 619 |
| | $ | (198,872 | ) | | $ | (21,173 | ) | | $ | 186,364 |
|
Net loss | — |
| | — |
| | — |
| | — |
| | (44,038 | ) | | — |
| | (44,038 | ) |
Translation adjustment | — |
| | — |
| | — |
| | (11 | ) | | — |
| | — |
| | (11 | ) |
Options exercised and other | 3 |
| | — |
| | 84 |
| | — |
| | — |
| | — |
| | 87 |
|
Purchase of treasury stock | (58 | ) | | — |
| | — |
| | — |
| | — |
| | (12,675 | ) | | (12,733 | ) |
Restricted stock grant, net of forfeitures | 1 |
| | — |
| | — |
| | — |
| | — |
| | — |
| | 1 |
|
Stock-based compensation | — |
| | — |
| | 1,407 |
| | — |
| | — |
| | — |
| | 1,407 |
|
Balance, March 31, 2013 | $ | 450 |
| | $ | 139 |
| | $ | 406,638 |
| | $ | 608 |
| | $ | (242,910 | ) | | $ | (33,848 | ) | | $ | 131,077 |
|
Net income (1)(2) | — |
| | — |
| | — |
| | — |
| | 4,376 |
| | — |
| | 4,376 |
|
Options exercised and other | 10 |
| | — |
| | 1,667 |
| | — |
| | — |
| | — |
| | 1,677 |
|
Purchase of treasury stock | (1 | ) | | — |
| | — |
| | — |
| | — |
| | (358 | ) | | (359 | ) |
Stock-based compensation | — |
| | — |
| | 1,871 |
| | — |
| | — |
| | — |
| | 1,871 |
|
Balance, March 31, 2014 (1)(2) | $ | 459 |
| | $ | 139 |
| | $ | 410,176 |
| | $ | 608 |
| | $ | (238,534 | ) | | $ | (34,206 | ) | | $ | 138,642 |
|
Net loss (1) | — |
| | — |
| | — |
| | — |
| | (58,902 | ) | | — |
| | (58,902 | ) |
Options exercised and other | 12 |
| | — |
| | 245 |
| | — |
| | — |
| | — |
| | 257 |
|
Purchase of treasury stock | (3 | ) | | — |
| | — |
| | — |
| | — |
| | (860 | ) | | (863 | ) |
Stock-based compensation | — |
| | — |
| | 2,605 |
| | — |
| | — |
| | — |
| | 2,605 |
|
Balance, March 31, 2015 (1) | $ | 468 |
| | $ | 139 |
| | $ | 413,026 |
| | $ | 608 |
| | $ | (297,436 | ) | | $ | (35,066 | ) | | $ | 81,739 |
|
(1) See Note 1 for restatement information.
(2) Certain amounts have been adjusted to reflect measurement period adjustments related to the CSI acquisition (see Note 2).
The accompanying notes are an integral part of these Consolidated Financial Statements.
WESTELL TECHNOLOGIES, INC. AND SUBSIDIARIES
CONSOLIDATED STATEMENTS OF CASH FLOWS
|
| | | | | | | | | | | |
(In thousands) | Fiscal Year Ended March 31, |
| 2015 (as restated (1)) | | 2014 (as restated and adjusted(1)(2)) | | 2013 |
Cash flows from operating activities: | | | | | |
Net income (loss) | $ | (58,902 | ) | | $ | 4,376 |
| | $ | (44,038 | ) |
Reconciliation of net income (loss) to net cash provided by (used in) operating activities: | | | | | |
Depreciation and amortization | 7,416 |
| | 5,511 |
| | 1,381 |
|
Goodwill impairment | 31,997 |
| | — |
| | 2,884 |
|
Stock-based compensation | 2,605 |
| | 1,871 |
| | 1,407 |
|
Exchange rate loss | 23 |
| | 33 |
| | — |
|
Impairment loss or loss (gain) on sale of fixed assets | 117 |
| | 8 |
| | (8 | ) |
Restructuring | 3,243 |
| | 335 |
| | 149 |
|
Deferred taxes | (127 | ) | | (8,440 | ) | | 29,865 |
|
Changes in assets and liabilities: | | | | | |
Accounts receivable | 3,986 |
| | (2,139 | ) | | (979 | ) |
Inventories | 8,186 |
| | 595 |
| | (2,002 | ) |
Prepaid expenses and other current assets | (1,661 | ) | | 742 |
| | (233 | ) |
Other assets | 137 |
| | 190 |
| | (240 | ) |
Deferred revenue | 605 |
| | (404 | ) | | (128 | ) |
Accounts payable and accrued expenses | (3,492 | ) | | (3,223 | ) | | 23 |
|
Accrued compensation | (3,420 | ) | | 2,142 |
| | (206 | ) |
Net cash provided by (used in) operating activities | (9,287 | ) | | 1,597 |
| | (12,125 | ) |
Cash flows from investing activities: | | | | | |
Maturities of held-to maturity short-term debt securities | 22,776 |
| | 28,514 |
| | 16,817 |
|
Maturities of other short-term investments | 1,985 |
| | 3,682 |
| | 6,796 |
|
Purchases of held-to maturity short-term debt securities | (24,662 | ) | | (21,955 | ) | | (29,090 | ) |
Purchases of other short-term investments | (8,421 | ) | | (1,476 | ) | | (4,417 | ) |
Purchases of property and equipment | (2,137 | ) | | (443 | ) | | (379 | ) |
Proceeds from sale of assets | — |
| | — |
| | 15 |
|
Acquisitions, net of cash acquired | (304 | ) | | (66,170 | ) | | (2,524 | ) |
Changes in restricted cash | — |
| | 2,500 |
| | 4,951 |
|
Net cash used in investing activities | (10,763 | ) | | (55,348 | ) | | (7,831 | ) |
Cash flows from financing activities: | | | | | |
Purchase of treasury stock | (863 | ) | | (359 | ) | | (12,733 | ) |
Payment of contingent consideration | (1,104 | ) | | — |
| | — |
|
Proceeds from stock options exercised | 257 |
| | 1,677 |
| | 87 |
|
Net cash provided by (used in) financing activities | (1,710 | ) | | 1,318 |
| | (12,646 | ) |
(Gain) loss of exchange rate changes on cash | (7 | ) | | (7 | ) | | 3 |
|
Net increase (decrease) in cash and cash equivalents | (21,767 | ) | | (52,440 | ) | | (32,599 | ) |
Cash and cash equivalents, beginning of period | 35,793 |
| | 88,233 |
| | 120,832 |
|
Cash and cash equivalents, end of period | $ | 14,026 |
| | $ | 35,793 |
| | $ | 88,233 |
|
Supplemental disclosures of cash flow information: | | | | | |
Cash paid (refunded) for income taxes, net | $ | 14 |
| | $ | 965 |
| | $ | (524 | ) |
(1) See Note 1 for restatement information.
(2) Certain amounts have been adjusted to reflect measurement period adjustments related to the CSI acquisition (see Note 2).
The accompanying notes are an integral part of these Consolidated Financial Statements.
WESTELL TECHNOLOGIES, INC. AND SUBSIDIARIES
NOTES TO CONSOLIDATED FINANCIAL STATEMENTS
Note 1. Basis of Presentation:
Description of Business
Westell Technologies, Inc. (the Company) is a holding company. Its wholly owned subsidiary, Westell, Inc., designs and distributes telecommunications products which are sold primarily to major telephone companies. Noran Tel, Inc. is a wholly owned subsidiary of Westell, Inc. Noran Tel's operations focus on power distribution product development and sales of Westell products in Canada. On April 1, 2013, Westell, Inc. acquired 100% of the outstanding shares of Kentrox, Inc. (Kentrox). Kentrox designs and distributes intelligent site management solutions that provide comprehensive monitoring, management and control of any site. On March 1, 2014, Westell, Inc. acquired 100% of the outstanding shares of Cellular Specialties, Inc. (CSI). CSI designs and develops in-building wireless solutions including distributed antenna systems (DAS) products and small cell connectivity equipment. The assets and liabilities acquired and the results of operations relating to Kentrox and CSI are included in the Company's Consolidated Financial Statements from the dates of acquisitions. See Note 2, Acquisitions.
Discontinued Operations
Sale of Conference Plus, Inc.
On December 31, 2011, the Company sold its wholly owned subsidiary, Conference Plus, Inc. (CPI) including Conference Plus Global Services, Ltd (CGPS), a wholly owned subsidiary of ConferencePlus (collectively, ConferencePlus) to Arkadin for $40.3 million in cash (the ConferencePlus sale). Of the total sale price, $4.1 million was placed in escrow at closing for the purpose of post-closing claims. During the fiscal year 2013, the Company recorded a contingent liability of $1.5 million, pre-tax, relating to claims raised by Arkadin under the indemnity provisions of the purchase sales agreement. This, along with certain other adjustments, resulted in a $1.4 million loss for fiscal year 2013. In fiscal years 2013 and 2014, $1.6 million and $2.5 million of the escrow were released with $3.0 million returned to the Company and $1.1 million paid to Arkadin. In fiscal year 2015, the Company reversed a contingency reserve related to potential indemnity claims that resulted in $0.1 million of income from discontinued operations. The activity for contingencies related to the sale of ConferencePlus presented herein have been classified as discontinued operations.
CNS Asset Sale
On April 15, 2011, the Company sold certain assets and transferred certain liabilities of the Customer Networking Solutions (CNS) segment to NETGEAR, Inc. for $36.7 million in cash (the CNS asset sale). The Company retained a major CNS customer relationship and contract, and also retained the Homecloud product development program. The Company completed the remaining contractually required product shipments under the retained contract in December 2011.
As part of the sale, the Company agreed to indemnify NETGEAR following the closing against specified losses in connection with the CNS business and generally retained responsibility for various legal liabilities that may accrue. A balance of $3.4 million was placed in escrow at closing for the purpose of post-closing claims. NETGEAR made a $0.9 million claim against the escrow balance for a dispute and indemnity claim regarding an interpretation of the sale agreement. The Company had previously recorded a $0.4 million contingency reserve for this claim at the time of the sale and recorded an additional expense of $0.5 million during fiscal year 2013 when the Company resolved the dispute through arbitration. The escrow was released at that time with $2.6 million refunded to the Company and $0.9 million paid to NETGEAR. The Company discontinued the remaining operations of the CNS segment in the first quarter of fiscal year 2014.
The Consolidated Statements of Cash Flows include discontinued operations.
Revenue and income before income taxes reported in discontinued operations is as follows:
|
| | | | | | | | | | | |
| Fiscal Year Ended March 31, |
(in thousands) | 2015 | | 2014 | | 2013 |
Discontinued CPI Revenue | $ | — |
| | $ | — |
| | $ | — |
|
Discontinued CNS Revenue | — |
| | — |
| | 1,236 |
|
Total discontinued operations revenue | $ | — |
| | $ | — |
| | $ | 1,236 |
|
| | | | | |
CPI income (loss) before income taxes | $ | 227 |
| | $ | — |
| | $ | (1,358 | ) |
CNS income (loss) before income taxes | — |
| | (45 | ) | | (951 | ) |
Total discontinued operations income (loss) before income taxes | $ | 227 |
| | $ | (45 | ) | | $ | (2,309 | ) |
Principles of Consolidation
The accompanying Consolidated Financial Statements include the accounts of the Company and its majority owned subsidiaries. The Consolidated Financial Statements have been prepared using accounting principles generally accepted in the United States (GAAP) and include the results of companies acquired by the Company from the date of each acquisition. All intercompany accounts and transactions have been eliminated in consolidation.
Use of Estimates
The preparation of financial statements in conformity with GAAP requires management to make estimates and assumptions that affect the reported amounts of assets and liabilities and disclosure of contingent assets and liabilities at the date of the financial statements, and that affect revenue and expenses during the periods reported. Estimates are used when accounting for the allowance for uncollectible accounts receivable, net realizable value of inventory, product warranty accrued, relative selling prices, stock-based compensation, goodwill and intangible assets fair value, depreciation, income taxes, and contingencies, among other things. The Company bases its estimate on historical experience and on other assumptions that its management believes are reasonable under the circumstances. Actual results could differ from those estimates.
Voluntary Change in Accounting Principle
Effective April 1, 2014, the Company made a voluntary change in accounting principle to classify shipping and handling costs associated with the distribution of finished product to our customers as cost of revenue (previously recorded in sales and marketing expense). The Company made the voluntary change in principle because it believes the classification of shipping and handling costs in cost of revenue better reflects the cost of producing and distributing products. It also enhances the comparability of the financial statements with many industry peers. As required by U.S. generally accepted accounting principles, the change has been reflected in the Consolidated Statements of Operations through retrospective application of the change in accounting principle.
Reconciliation to Previously Reported Financial Data
The following table provides the reconciliation from previously reported financial data, as restated and adjusted:
|
| | | | | | | | | | | | | | | | | | | | | | | | | | | | | | | | |
| | Fiscal Year ended March 31, 2014 | | Fiscal Year ended March 31, 2013 |
(in thousands) | | Previously reported | | Effect of Accounting Principle Change (1) | | Effect of CSI Purchase Accounting Adjustment (2) | | Adjustments (3) | | Adjusted | | Previously reported | | Effect of Accounting Principle Change (1) | | Adjusted |
Revenue | | $ | 102,073 |
| | $ | — |
| | $ | — |
| | $ | — |
| | $ | 102,073 |
| | $ | 38,808 |
| | $ | — |
| | $ | 38,808 |
|
Cost of revenue | | 60,115 |
| | 1,359 |
| | 138 |
| | — |
| | 61,612 |
| | 25,483 |
| | 709 |
| | 26,192 |
|
Gross profit | | $ | 41,958 |
| | $ | (1,359 | ) | | $ | (138 | ) | | $ | — |
| | $ | 40,461 |
| | $ | 13,325 |
| | $ | (709 | ) | | $ | 12,616 |
|
Gross margin | | 41.1 | % | | | | | | | | 39.6 | % | | 34.3 | % | | | | 32.5 | % |
| | | | | | | | | | | | | | | | |
Sales and marketing | | $ | 14,663 |
| | $ | (1,359 | ) | | $ | — |
| | $ | — |
| | $ | 13,304 |
| | $ | 7,492 |
| | $ | (709 | ) | | $ | 6,783 |
|
Intangible Amortization | | $ | 4,908 |
| | $ | — |
| | $ | (19 | ) | | $ | — |
| | $ | 4,889 |
| | $ | 887 |
| | $ | — |
| | $ | 887 |
|
Income tax (expense) benefit | | $ | 8,782 |
| | $ | — |
| | $ | (322 | ) | | $ | (550 | ) | | $ | 7,910 |
| | $ | (29,392 | ) | | $ | — |
| | $ | (29,392 | ) |
Net income (loss) | | $ | 5,367 |
| | $ | — |
| | $ | (441 | ) | | $ | (550 | ) | | $ | 4,376 |
| | $ | (44,038 | ) | | $ | — |
| | $ | (44,038 | ) |
(1) See Voluntary Change in Accounting Principle above
(2) Certain amounts have been adjusted to reflect measurement period adjustments related to the CSI acquisition (see Note 2).
(3) See Restatement of Consolidated Financial Statements below in Note 1.
The impact of this change in accounting principle was an increase to cost of revenue and a reduction to sales and marketing expense of $1.4 million and $0.7 million in the fiscal years ended March 31, 2014 and 2013, respectively. Gross profit and gross profit percentage were reduced accordingly. The amount included in cost of sales that would have been included in sales and marketing historically was $0.9 million for the fiscal year ended March 31, 2015. The change had no effect on income from continuing operations, net income, earnings per share, or retained earnings for any period.
Reclassifications
In addition to the reclassification of shipping and handling costs disclosed above, certain amounts in the Consolidated Financial Statements for fiscal year 2014 have been reclassified to reflect measurement period adjustments related to the CSI acquisition. See Note 2, Acquisitions.
Restatement of Consolidated Financial Statements
On October 27, 2015, the Company determined that it needed to restate financial results due to an unrecorded liability of $1.4 million related to a contractual obligation that existed prior to the Kentrox acquisition. The effect of recording the liability in purchase accounting on April 1, 2013 created an additional deferred tax asset of $0.6 million and a $0.9 million increase in goodwill at the acquisition date.
The Company fully reserves its deferred tax assets; therefore, the creation of the deferred tax asset recorded in purchase accounting required an offsetting valuation allowance, which decreased the income tax benefit recorded in quarter ended March 31, 2014 by $0.6 million. In addition, since the Company previously wrote off all of the goodwill related to the Kentrox acquisition, which was part of the CSG reporting unit, in the quarter ended September 30, 2014, the actual impairment charge recorded should have been $0.9 million higher in that quarter. The cumulative overstatement of income was therefore $1.4 million.
As a result, the Company concluded that the financial statements for the years ended March 31, 2015 and 2014, and the quarterly periods within these years, as well as the quarter ended June 30, 2015, were materially misstated.
The Consolidated Balance Sheets, Consolidated Statement of Operations, Consolidated Statement of Comprehensive Income (Loss), Consolidated Statement of Stockholders' Equity, and Consolidated Statement of Cash Flows, as well as Notes 2, 4, 10, and 17, have been restated to reflect the correction of the aforementioned errors.
Below is a summary of the impacts of the restatement adjustments on the Company's previously reported consolidated net income (loss): |
| | | | | | | | | | | | | | | | | | | |
| Fiscal Year 2015 Quarter Ended, | | Fiscal Year Ended, |
(in thousands) | June 30, 2014 | | Sept. 30, 2014 | | Dec. 31, 2014 | | Mar. 31, 2015 | | Mar. 31, 2015 |
Net income (loss) previously reported | $ | (2,818 | ) | | $ | (14,649 | ) | | $ | (27,540 | ) | | $ | (13,000 | ) | | $ | (58,007 | ) |
Goodwill impairment adjustment | — |
| | 895 |
| | — |
| | — |
| | 895 |
|
Net income (loss) as restated | $ | (2,818 | ) | | $ | (15,544 | ) | | $ | (27,540 | ) | | $ | (13,000 | ) | | $ | (58,902 | ) |
| | | | | | | | | |
| Fiscal Year 2014 Quarter Ended | | Fiscal Year Ended, |
| June 30, 2013 | | Sept. 30, 2013 | | Dec. 31, 2013 | | Mar. 31, 2014 | | Mar. 31, 2014 |
Net income (loss) previously reported | $ | (2,764 | ) | | $ | 1,328 |
| | $ | 1,925 |
| | $ | 4,437 |
| | $ | 4,926 |
|
Income tax expense adjustment | — |
| | — |
| | — |
| | 550 |
| | 550 |
|
Net income (loss) as restated | $ | (2,764 | ) | | $ | 1,328 |
| | $ | 1,925 |
| | $ | 3,887 |
| | $ | 4,376 |
|
The following tables provide a reconciliation of the amounts previously reported to the restated amounts for the years ended March 31, 2014 and March 31, 2015.
WESTELL TECHNOLOGIES, INC. AND SUBSIDIARIES
CONSOLIDATED BALANCE SHEETS |
| | | | | | | | | | | | |
(In thousands, except share amounts) | March 31, 2014(as reported) | | Adjustments | | March 31, 2014(as restated) | |
Assets | | | | | | |
Current assets: | | | | | | |
Cash and cash equivalents | $ | 35,793 |
| | $ | — |
| | $ | 35,793 |
| |
Short-term investments | 15,584 |
| | — |
| | 15,584 |
| |
Accounts receivable | 15,831 |
| | — |
| | 15,831 |
| |
Inventories | 24,056 |
| | — |
| | 24,056 |
| |
Prepaid expenses and other current assets | 1,952 |
| | — |
| | 1,952 |
| |
Deferred income tax assets | 899 |
| | 550 |
| | 1,449 |
| |
Land held-for-sale | 264 |
| | — |
| | 264 |
| |
Total current assets | 94,379 |
| | 550 |
| | 94,929 |
| |
Land, Property and equipment: | | | | | | |
Land | 780 |
| | — |
| | 780 |
| |
Machinery and equipment | 1,413 |
| | — |
| | 1,413 |
| |
Office, computer and research equipment | 9,039 |
| | — |
| | 9,039 |
| |
Leasehold improvements | 7,450 |
| | — |
| | 7,450 |
| |
Total property and equipment, gross | 18,682 |
| | — |
| | 18,682 |
| |
Less accumulated depreciation and amortization | (16,001 | ) | | — |
| | (16,001 | ) | |
Property and equipment, net | 2,681 |
| | — |
| | 2,681 |
| |
Goodwill | 31,102 |
| | 895 |
| | 31,997 |
| |
Other intangible assets, net | 32,319 |
| | — |
| | 32,319 |
| |
Other non-current assets | 393 |
| | — |
| | 393 |
| |
Total assets | $ | 160,874 |
| | $ | 1,445 |
| | $ | 162,319 |
| |
Liabilities and Stockholders’ Equity | | | | | | |
Current liabilities: | | | | | | |
Accounts payable | $ | 7,508 |
| | $ | — |
| | $ | 7,508 |
| |
Accrued expenses | 2,920 |
| | 1,445 |
| | 4,365 |
| |
Accrued restructuring | 57 |
| | — |
| | 57 |
| |
Accrued compensation | 4,395 |
| | — |
| | 4,395 |
| |
Contingent consideration | 2,067 |
| | — |
| | 2,067 |
| |
Deferred revenue | 1,774 |
| | — |
| | 1,774 |
| |
Total current liabilities | 18,721 |
| | 1,445 |
| | 20,166 |
| |
Deferred revenue non-current | 787 |
| | | | 787 |
| |
Deferred income tax liability | 1,072 |
| | 550 |
| | 1,622 |
| |
Accrued restructuring non-current | — |
| | — |
| | — |
| |
Contingent consideration non-current | 574 |
| | — |
| | 574 |
| |
Other non-current liabilities | 528 |
| | — |
| | 528 |
| |
Total liabilities | 21,682 |
| | 1,995 |
| | 23,677 |
| |
Stockholders’ equity: | | | | |
| |
Class A common stock | 459 |
| | — |
| | 459 |
| |
Class B common stock | 139 |
| | — |
| | 139 |
| |
Additional paid-in capital | 410,176 |
| | — |
| | 410,176 |
| |
Treasury stock at cost | (34,206 | ) | | — |
| | (34,206 | ) | |
Cumulative translation adjustment | 608 |
| | — |
| | 608 |
| |
Accumulated deficit | (237,984 | ) | | (550 | ) | | (238,534 | ) | |
Total stockholders’ equity | 139,192 |
| | (550 | ) | | 138,642 |
| |
Total liabilities and stockholders’ equity | $ | 160,874 |
| | $ | 1,445 |
| | $ | 162,319 |
| |
WESTELL TECHNOLOGIES, INC. AND SUBSIDIARIES
CONSOLIDATED BALANCE SHEETS |
| | | | | | | | | | | |
(In thousands, except share amounts) | March 31, 2015(as reported) | | Adjustments | | March 31, 2015(as restated) |
Assets | | | | | |
Current assets: | | | | | |
Cash and cash equivalents | $ | 14,026 |
| | $ | — |
| | $ | 14,026 |
|
Short-term investments | 23,906 |
| | — |
| | 23,906 |
|
Accounts receivable | 11,845 |
| | — |
| | 11,845 |
|
Inventories | 16,205 |
| | — |
| | 16,205 |
|
Prepaid expenses and other current assets | 3,285 |
| | — |
| | 3,285 |
|
Deferred income tax assets | 973 |
| | 70 |
| | 1,043 |
|
Land held-for-sale | 264 |
| | — |
| | 264 |
|
Total current assets | 70,504 |
| | 70 |
| | 70,574 |
|
Land, Property and equipment: | | | | | |
Land | 672 |
| | — |
| | 672 |
|
Machinery and equipment | 1,701 |
| | — |
| | 1,701 |
|
Office, computer and research equipment | 6,260 |
| | — |
| | 6,260 |
|
Leasehold improvements | 7,451 |
| | — |
| | 7,451 |
|
Total property and equipment, gross | 16,084 |
| | — |
| | 16,084 |
|
Less accumulated depreciation and amortization | (12,481 | ) | | — |
| | (12,481 | ) |
Property and equipment, net | 3,603 |
| | — |
| | 3,603 |
|
Goodwill | — |
| | — |
| | — |
|
Other intangible assets, net | 25,942 |
| | — |
| | 25,942 |
|
Other non-current assets | 258 |
| | — |
| | 258 |
|
Total assets | $ | 100,307 |
| | $ | 70 |
| | $ | 100,377 |
|
Liabilities and Stockholders’ Equity | | | | | |
Current liabilities: | | | | | |
Accounts payable | $ | 4,011 |
| | $ | — |
| | $ | 4,011 |
|
Accrued expenses | 3,157 |
| | 1,445 |
| | 4,602 |
|
Accrued restructuring | 1,161 |
| | — |
| | 1,161 |
|
Accrued compensation | 974 |
| | — |
| | 974 |
|
Contingent consideration | 1,184 |
| | — |
| | 1,184 |
|
Deferred revenue | 2,415 |
| | — |
| | 2,415 |
|
Total current liabilities | 12,902 |
| | 1,445 |
| | 14,347 |
|
Deferred revenue non-current | 751 |
| | — |
| | 751 |
|
Deferred income tax liability | 1,019 |
| | 70 |
| | 1,089 |
|
Accrued restructuring non-current | 1,642 |
| | — |
| | 1,642 |
|
Contingent consideration non-current | 400 |
| | — |
| | 400 |
|
Other non-current liabilities | 409 |
| | — |
| | 409 |
|
Total liabilities | 17,123 |
| | 1,515 |
| | 18,638 |
|
Stockholders’ equity: | | | | | |
Class A common stock | 468 |
| | — |
| | 468 |
|
Class B common stock | 139 |
| | — |
| | 139 |
|
Additional paid-in capital | 413,026 |
| | — |
| | 413,026 |
|
Treasury stock at cost | (35,066 | ) | | — |
| | (35,066 | ) |
Cumulative translation adjustment | 608 |
| | — |
| | 608 |
|
Accumulated deficit | (295,991 | ) | | (1,445 | ) | | (297,436 | ) |
Total stockholders’ equity | 83,184 |
| | (1,445 | ) | | 81,739 |
|
Total liabilities and stockholders’ equity | $ | 100,307 |
| | $ | 70 |
| | $ | 100,377 |
|
WESTELL TECHNOLOGIES, INC. AND SUBSIDIARIES
CONSOLIDATED STATEMENTS OF OPERATIONS |
| | | | | | | | | | | |
(In thousands, except per share amounts) | Fiscal Year Ended March 31, |
| 2014
(as reported) | | Adjustments | | 2014
(as restated) |
Revenue | $ | 102,073 |
| | $ | — |
| | $ | 102,073 |
|
Cost of revenue | 61,612 |
| | — |
| | 61,612 |
|
Gross profit | 40,461 |
| | — |
| | 40,461 |
|
Operating expenses: | | | | | — |
|
Sales and marketing | 13,304 |
| | — |
| | 13,304 |
|
Research and development | 11,339 |
| | — |
| | 11,339 |
|
General and administrative | 14,027 |
| | — |
| | 14,027 |
|
Intangible amortization | 4,889 |
| | — |
| | 4,889 |
|
Restructuring | 335 |
| | — |
| | 335 |
|
Goodwill impairment | — |
| | — |
| | — |
|
Total operating expenses | 43,894 |
| | — |
| | 43,894 |
|
Operating loss from continuing operations | (3,433 | ) | | — |
| | (3,433 | ) |
Other income (expense), net | (56 | ) | | — |
| | (56 | ) |
Loss before income taxes and discontinued operations | (3,489 | ) | | — |
| | (3,489 | ) |
Income tax (expense) benefit | 8,460 |
| | (550 | ) | | 7,910 |
|
Net income (loss) from continuing operations | 4,971 |
| | (550 | ) | | 4,421 |
|
Discontinued operations (Note 1): | | | | |
|
Income (loss) from discontinued operations, net of tax benefit (expense) of $(88), $0 and $813 for fiscal years 2015, 2014 and 2013, respectively | (45 | ) | | — |
| | (45 | ) |
Net income (loss) | $ | 4,926 |
| | $ | (550 | ) | | $ | 4,376 |
|
Basic net income (loss) per share: | | | | |
|
Basic net income (loss) from continuing operations | $ | 0.08 |
| | $ | (0.01 | ) | | $ | 0.08 |
|
Basic net income (loss) from discontinued operations | — |
| | — |
| | — |
|
Basic net income (loss) per share | $ | 0.08 |
| | $ | (0.01 | ) | | $ | 0.07 |
|
Diluted net income (loss) per share: | | | | |
|
Diluted net income (loss) from continuing operations | $ | 0.08 |
| | $ | (0.01 | ) | | $ | 0.07 |
|
Diluted net income (loss) from discontinued operations | — |
| | — |
| | — |
|
Diluted net income (loss) per share | $ | 0.08 |
| | $ | (0.01 | ) | | $ | 0.07 |
|
Weighted-average number of shares outstanding: | | | | |
|
Basic | 58,786 |
| | — |
| | 58,786 |
|
Effect of dilutive securities: restricted stock, restricted stock units, performance stock units and stock options(3) | 1,262 |
| | — |
| | 1,262 |
|
Diluted | 60,048 |
| | — |
| | 60,048 |
|
WESTELL TECHNOLOGIES, INC. AND SUBSIDIARIES
CONSOLIDATED STATEMENTS OF OPERATIONS |
| | | | | | | | | | | |
(In thousands, except per share amounts) | Fiscal Year Ended March 31, |
| 2015
(as reported) | | Adjustments | | 2015
(as restated) |
Revenue | $ | 84,127 |
| | $ | — |
| | $ | 84,127 |
|
Cost of revenue | 57,317 |
| | — |
| | 57,317 |
|
Gross profit | 26,810 |
| | — |
| | 26,810 |
|
Operating expenses: | | | | | — |
|
Sales and marketing | 12,407 |
| | — |
| | 12,407 |
|
Research and development | 17,348 |
| | — |
| | 17,348 |
|
General and administrative | 14,678 |
| | — |
| | 14,678 |
|
Intangible amortization | 6,377 |
| | — |
| | 6,377 |
|
Restructuring | 3,243 |
| | — |
| | 3,243 |
|
Goodwill impairment | 31,102 |
| | 895 |
| | 31,997 |
|
Total operating expenses | 85,155 |
| | 895 |
| | 86,050 |
|
Operating loss from continuing operations | (58,345 | ) | | (895 | ) | | (59,240 | ) |
Other income (expense), net | (2 | ) | | — |
| | (2 | ) |
Loss before income taxes and discontinued operations | (58,347 | ) | | (895 | ) | | (59,242 | ) |
Income tax (expense) benefit | 201 |
| | — |
| | 201 |
|
Net income (loss) from continuing operations | (58,146 | ) | | (895 | ) | | (59,041 | ) |
Discontinued operations (Note 1): | | | | | |
Income (loss) from discontinued operations, net of tax benefit (expense) of $(88), $0 and $813 for fiscal years 2015, 2014 and 2013, respectively | 139 |
| | — |
| | 139 |
|
Net income (loss) | $ | (58,007 | ) | | $ | (895 | ) | | $ | (58,902 | ) |
Basic net income (loss) per share: | | | | | |
Basic net income (loss) from continuing operations | $ | (0.97 | ) | | $ | (0.01 | ) | | $ | (0.98 | ) |
Basic net income (loss) from discontinued operations | — |
| | — |
| | — |
|
Basic net income (loss) per share | $ | (0.97 | ) | | $ | (0.01 | ) | | $ | (0.98 | ) |
Diluted net income (loss) per share: | | | | | |
Diluted net income (loss) from continuing operations | $ | (0.97 | ) | | $ | (0.01 | ) | | $ | (0.98 | ) |
Diluted net income (loss) from discontinued operations | — |
| | — |
| | — |
|
Diluted net income (loss) per share | $ | (0.97 | ) | | $ | (0.01 | ) | | $ | (0.98 | ) |
Weighted-average number of shares outstanding: | | | | | |
Basic | 59,985 |
| | — |
| | 59,985 |
|
Effect of dilutive securities: restricted stock, restricted stock units, performance stock units and stock options(3) | — |
| | — |
| | — |
|
Diluted | 59,985 |
| | — |
|
| 59,985 |
|
WESTELL TECHNOLOGIES, INC. AND SUBSIDIARIES
CONSOLIDATED STATEMENTS OF COMPREHENSIVE INCOME (LOSS)
|
| | | | | | | | | | | |
(In thousands) | Fiscal Year Ended March 31, |
| 2014 (as reported) | | Adjustments | | 2014 (as restated) |
Net income (loss) | $ | 4,926 |
| | $ | (550 | ) | | $ | 4,376 |
|
Other comprehensive income (loss): | | | | |
|
Foreign currency translation adjustment | — |
| | — |
| | — |
|
Total other comprehensive income (loss) | — |
| | — |
| | — |
|
Total comprehensive income (loss) | $ | 4,926 |
| | $ | (550 | ) | | $ | 4,376 |
|
|
| | | | | | | | | | | |
(In thousands) | Fiscal Year Ended March 31, |
| 2015 (as reported) | | Adjustments | | 2015 (as restated) |
Net income (loss) | $ | (58,007 | ) | | $ | (895 | ) | | $ | (58,902 | ) |
Other comprehensive income (loss): | | | | | |
Foreign currency translation adjustment | — |
| | — |
| | — |
|
Total other comprehensive income (loss) | — |
| | — |
| | — |
|
Total comprehensive income (loss) | $ | (58,007 | ) | | $ | (895 | ) | | $ | (58,902 | ) |
WESTELL TECHNOLOGIES, INC. AND SUBSIDIARIES
CONSOLIDATED STATEMENTS OF STOCKHOLDERS’ EQUITY
|
| | | | | | | | | | | |
(In thousands) | Fiscal Year Ended March 31, |
| 2014 (as reported) | | Adjustments | | 2014 (as restated) |
Common Stock Class A | $ | 459 |
| | $ | — |
| | $ | 459 |
|
Common Stock Class B | 139 |
| | — |
| | 139 |
|
Additional paid-in-capital | 410,176 |
| | — |
| | 410,176 |
|
Accumulated translation adjustment | 608 |
| | — |
| | 608 |
|
Accumulated deficit | (237,984 | ) | | (550 | ) | | (238,534 | ) |
Treasury stock | (34,206 | ) | | — |
| | (34,206 | ) |
Total stockholders' equity | $ | 139,192 |
| | $ | (550 | ) | | $ | 138,642 |
|
|
| | | | | | | | | | | |
(In thousands) | Fiscal Year Ended March 31, |
| 2015 (as reported) | | Adjustments | | 2015 (as restated) |
Common Stock Class A | $ | 468 |
| | $ | — |
| | $ | 468 |
|
Common Stock Class B | 139 |
| | — |
| | 139 |
|
Additional paid-in-capital | 413,026 |
| | — |
| | 413,026 |
|
Accumulated translation adjustment | 608 |
| | — |
| | 608 |
|
Accumulated deficit | (295,991 | ) | | (1,445 | ) | | (297,436 | ) |
Treasury stock | (35,066 | ) | | — |
| | (35,066 | ) |
Total stockholders' equity | $ | 83,184 |
| | $ | (1,445 | ) | | $ | 81,739 |
|
WESTELL TECHNOLOGIES, INC. AND SUBSIDIARIES
CONSOLIDATED STATEMENTS OF CASH FLOWS |
| | | | | | | | | | | |
(In thousands) | Fiscal Year Ended March 31, |
| 2014 (as reported) | | Adjustments | | 2014 (as restated) |
Cash flows from operating activities: | | | | | |
Net income (loss) | $ | 4,926 |
| | $ | (550 | ) | | $ | 4,376 |
|
Reconciliation of net income (loss) to net cash provided by (used in) operating activities: | | | | | |
Depreciation and amortization | 5,511 |
| | — |
| | 5,511 |
|
Goodwill impairment | — |
| | — |
| | — |
|
Stock-based compensation | 1,871 |
| | — |
| | 1,871 |
|
Exchange rate loss | 33 |
| | — |
| | 33 |
|
Impairment loss or loss (gain) on sale of fixed assets | 8 |
| | — |
| | 8 |
|
Restructuring | 335 |
| | — |
| | 335 |
|
Deferred taxes | (8,990 | ) | | 550 |
| | (8,440 | ) |
Changes in assets and liabilities: | | | | | — |
|
Accounts receivable | (2,139 | ) | | — |
| | (2,139 | ) |
Inventories | 595 |
| | — |
| | 595 |
|
Prepaid expenses and other current assets | 742 |
| | — |
| | 742 |
|
Other assets | 190 |
| | — |
| | 190 |
|
Deferred revenue | (404 | ) | | — |
| | (404 | ) |
Accounts payable and accrued expenses | (3,223 | ) | | — |
| | (3,223 | ) |
Accrued compensation | 2,142 |
| | — |
| | 2,142 |
|
Net cash provided by (used in) operating activities | 1,597 |
| | — |
| | 1,597 |
|
Cash flows from investing activities: | | | | | |
Maturities of held-to maturity short-term debt securities | 28,514 |
| | — |
| | 28,514 |
|
Maturities of other short-term investments | 3,682 |
| | — |
| | 3,682 |
|
Purchases of held-to maturity short-term debt securities | (21,955 | ) | | — |
| | (21,955 | ) |
Purchases of other short-term investments | (1,476 | ) | | — |
| | (1,476 | ) |
Purchases of property and equipment | (443 | ) | | — |
| | (443 | ) |
Proceeds from sale of assets | — |
| | — |
| | — |
|
Acquisitions, net of cash acquired | (66,170 | ) | | — |
| | (66,170 | ) |
Changes in restricted cash | 2,500 |
| | — |
| | 2,500 |
|
Net cash used in investing activities | (55,348 | ) | | — |
| | (55,348 | ) |
Cash flows from financing activities: | | | | | |
Purchase of treasury stock | (359 | ) | | — |
| | (359 | ) |
Payment of contingent consideration | — |
| | — |
| | — |
|
Proceeds from stock options exercised | 1,677 |
| | — |
| | 1,677 |
|
Net cash provided by (used in) financing activities | 1,318 |
| | — |
| | 1,318 |
|
(Gain) loss of exchange rate changes on cash | (7 | ) | | — |
| | (7 | ) |
Net increase (decrease) in cash and cash equivalents | (52,440 | ) | | — |
| | (52,440 | ) |
Cash and cash equivalents, beginning of period | 88,233 |
| | — |
| | 88,233 |
|
Cash and cash equivalents, end of period | $ | 35,793 |
| | $ | — |
| | $ | 35,793 |
|
WESTELL TECHNOLOGIES, INC. AND SUBSIDIARIES
CONSOLIDATED STATEMENTS OF CASH FLOWS |
| | | | | | | | | | | |
(In thousands) | Fiscal Year Ended March 31, |
| 2015 (as restated) | | Adjustments | | 2015 (as restated) |
Cash flows from operating activities: | | | | | |
Net income (loss) | $ | (58,007 | ) | | $ | (895 | ) | | $ | (58,902 | ) |
Reconciliation of net income (loss) to net cash provided by (used in) operating activities: | | | | | |
Depreciation and amortization | 7,416 |
| | — |
| | 7,416 |
|
Goodwill impairment | 31,102 |
| | 895 |
| | 31,997 |
|
Stock-based compensation | 2,605 |
| | — |
| | 2,605 |
|
Exchange rate loss | 23 |
| | — |
| | 23 |
|
Impairment loss or loss (gain) on sale of fixed assets | 117 |
| | — |
| | 117 |
|
Restructuring | 3,243 |
| | — |
| | 3,243 |
|
Deferred taxes | (127 | ) | | — |
| | (127 | ) |
Changes in assets and liabilities: | | | | | — |
|
Accounts receivable | 3,986 |
| | — |
| | 3,986 |
|
Inventories | 8,186 |
| | — |
| | 8,186 |
|
Prepaid expenses and other current assets | (1,661 | ) | | — |
| | (1,661 | ) |
Other assets | 137 |
| | — |
| | 137 |
|
Deferred revenue | 605 |
| | — |
| | 605 |
|
Accounts payable and accrued expenses | (3,492 | ) | | — |
| | (3,492 | ) |
Accrued compensation | (3,420 | ) | | — |
| | (3,420 | ) |
Net cash provided by (used in) operating activities | (9,287 | ) | | — |
| | (9,287 | ) |
Cash flows from investing activities: | | | | | |
Maturities of held-to maturity short-term debt securities | 22,776 |
| | — |
| | 22,776 |
|
Maturities of other short-term investments | 1,985 |
| | — |
| | 1,985 |
|
Purchases of held-to maturity short-term debt securities | (24,662 | ) | | — |
| | (24,662 | ) |
Purchases of other short-term investments | (8,421 | ) | | — |
| | (8,421 | ) |
Purchases of property and equipment | (2,137 | ) | | — |
| | (2,137 | ) |
Proceeds from sale of assets | — |
| | — |
| | — |
|
Acquisitions, net of cash acquired | (304 | ) | | — |
| | (304 | ) |
Changes in restricted cash | — |
| | — |
| | — |
|
Net cash used in investing activities | (10,763 | ) | | — |
| | (10,763 | ) |
Cash flows from financing activities: | | | | | |
Purchase of treasury stock | (863 | ) | | — |
| | (863 | ) |
Payment of contingent consideration | (1,104 | ) | | — |
| | (1,104 | ) |
Proceeds from stock options exercised | 257 |
| | — |
| | 257 |
|
Net cash provided by (used in) financing activities | (1,710 | ) | | — |
| | (1,710 | ) |
(Gain) loss of exchange rate changes on cash | (7 | ) | | — |
| | (7 | ) |
Net increase (decrease) in cash and cash equivalents | (21,767 | ) | | — |
| | (21,767 | ) |
Cash and cash equivalents, beginning of period | 35,793 |
| | — |
| | 35,793 |
|
Cash and cash equivalents, end of period | $ | 14,026 |
| | $ | — |
| | $ | 14,026 |
|
Note 2. Acquisitions:
CSI Acquisition
On March 1, 2014, the Company's wholly-owned subsidiary, Westell, Inc. acquired 100% of the outstanding shares of Cellular Specialties, Inc. (CSI) for a purchase price of $39.0 million in cash plus a $5.0 million working capital adjustment. CSI is an innovator of in-building wireless connectivity solutions for 3G/4G cellular services enabling indoor wireless coverage anytime, anywhere. ClearLink, CSI’s high performance, low PIM brand of in-building products are designed for distributed antenna systems (DASs). ClearLink products include Universal DAS interface Trays (UDIT), passive DAS interface units, system components, and antennas. CSI’s portfolio also includes digital repeaters, bi-directional amplifiers, and E911 and location-based enhancement solutions for wireless networks.
The Company incurred $39,000 and $0.2 million of related acquisition costs in fiscal year 2015 and 2014, respectively, which were expensed as incurred and reflected in general and administrative costs in the Consolidated Statement of Operations.
The results of CSI's operations have been included in the Consolidated Financial Statements since the date of acquisition and are reported within the In-Building Wireless (IBW) reporting segment. CSI contributed $29.5 million and $3.7 million to revenue and $26.9 million and $0.4 million to operating loss in fiscal year 2015 and 2014, respectively. Operating loss includes a write off of goodwill in fiscal year 2015.
In accordance with the acquisition method of accounting for business combinations, the Company allocated the total purchase consideration transferred to identifiable tangible and intangible assets acquired and liabilities assumed at the acquisition date based on each element’s estimated fair value with the remaining unallocated amounts recorded as goodwill. Purchased intangibles will be amortized over their respective estimated useful lives. Goodwill represents the expected synergies and other benefits from this acquisition that relates to the Company’s market position, customer relationships and supply chain capabilities. Goodwill recorded on the CSI acquisition is not expected to be amortized or deductible for U.S. federal and state income tax purposes. In the third quarter of fiscal year 2015, the Company performed an in interim evaluation of goodwill and concluded that the $20.5 million from the CSI acquisition, which was evaluated under the IBW reporting unit, was fully impaired and recorded as a charge to Consolidated Results of Operation in that quarter. Refer to Note 5, Goodwill and Intangible Assets.
The following table summarizes the fair value of the assets acquired and liabilities assumed as of the March 1, 2014, acquisition date:
|
| | | | | | | | | | | |
(in thousands) | Preliminary Amounts Recognized as of Acquisition Date (1) | | Measurement Period Adjustments | | Final Amounts Recognized |
Cash | $ | 6,513 |
| | $ | — |
| | $ | 6,513 |
|
Accounts receivable | 2,920 |
| | (20 | ) | (4) | 2,900 |
|
Inventories | 7,625 |
| | (242 | ) | (4) | 7,383 |
|
Prepaid expenses and other current assets | 158 |
| | (23 | ) | (4) | 135 |
|
Property and equipment | 816 |
| | (45 | ) | (4) | 771 |
|
Intangible assets | 16,230 |
| | (57 | ) | (2) | 16,173 |
|
Accounts payable, accruals and other liabilities | (2,875 | ) | | (37 | ) | (4) | (2,912 | ) |
Income tax payable | (1,175 | ) | | — |
| | (1,175 | ) |
Deferred income tax liability | (6,616 | ) | | 323 |
| (2) | (6,293 | ) |
Goodwill | 20,142 |
| | 405 |
| | 20,547 |
|
Total Consideration | $ | 43,738 |
| | $ | 304 |
| (3) | $ | 44,042 |
|
(1) As previously reported in the Notes to the Consolidated Financial Statements included in our 2014 Form 10-K.
(2) Intangible asset fair value adjustment for trade name and related tax effect.
(3) Payment for final working capital adjustment.
(4) Other measurement period adjustments mostly related to inventory adjustments.
Under ASC topic 805, Business Combinations, the Company is required to recognize adjustments to provisional amounts during the measurement period as they are identified, and to recognize such adjustments retrospectively, as if the accounting for the business combination had been completed at the acquisition date. The March 31, 2014 balance sheet has been adjusted to reflect the measurement period adjustments, including the working capital adjustment which was included in accounts payable.
The following table summarizes the acquired identified intangible assets and the respective fair value and estimated useful life at the date of acquisition:
|
| | | | | | |
(in thousands) | | Fair Value | | Estimated Life |
Backlog | | $ | 90 |
| | 1 month |
Customer relationships | | 11,410 |
| | 9 years |
Trademark | | 303 |
| | 1 year |
Developed technology | | 3,860 |
| | 3 years |
Non-compete | | 510 |
| | 2 years |
Total intangible assets | | $ | 16,173 |
| | |
Kentrox Acquisition
On April 1, 2013, the Company's wholly-owned subsidiary, Westell, Inc., acquired 100% of the outstanding shares of Kentrox, Inc. (Kentrox) for a purchase price of $30.0 million in cash, plus a $1.3 million working capital adjustment, pursuant to an agreement dated March 15, 2013. Kentrox is a worldwide leader in intelligent site management solutions, providing comprehensive monitoring, management and control of any site. The machine-to-machine communications Kentrox provides enable service providers, tower operators, and other network operators to reduce operating costs while improving network performance. Kentrox provides solutions to customers in North and South America, Australia, Africa, and Europe. The acquisition added a highly complementary product line that is wireless focused, software centric and globally deployed.
The Company incurred $0.3 million of related acquisition costs in the fourth quarter of fiscal year 2013 which were expensed as incurred and reflected in general and administrative costs in the Consolidated Statement of Operations.
The results of Kentrox's operations have been included in the Consolidated Financial Statements since the date of acquisition and are reported as a separate operating segment. Kentrox contributed $46.2 million to revenue and $7.3 million to operating income in the twelve months ended March 31, 2014. The Kentrox operations were merged into Westell, Inc.'s operations and separate financial information is not available for fiscal year 2015.
In accordance with the acquisition method of accounting for business combinations, the Company allocated the total purchase consideration transferred to identifiable tangible and intangible assets acquired and liabilities assumed at the acquisition date based on each element’s estimated fair value with the remaining unallocated amounts recorded as goodwill. Purchased intangibles will be amortized over their respective estimated useful lives. Goodwill represents the expected synergies and other benefits from this acquisition that relates to the Company’s market position, customer relationships and supply chain capabilities. Goodwill recorded on the Kentrox acquisition is not expected to be amortized or deductible for U.S. federal and state income tax purposes. In the second quarter of fiscal year 2015, the Company performed an in interim evaluation of goodwill and concluded that the $11.5 million from the Kentrox acquisition, which was evaluated under the CSG reporting unit, was fully impaired and recorded as a charge to Consolidated Results of Operation in that quarter. Refer to Note 5, Goodwill and Intangible Assets.
The following table summarizes the fair values of the assets acquired and liabilities assumed on the April 1, 2013, acquisition date:
|
| | | | | | | | | | | |
(in thousands) | As previously reported | | Adjustments (1) | | As restated (1) |
Cash | $ | 2,355 |
| | $ | — |
| | $ | 2,355 |
|
Inventories | 5,045 |
| | — |
| | 5,045 |
|
Accounts receivable | 4,325 |
| | — |
| | 4,325 |
|
Land held-for-sale | 1,044 |
| | — |
| | 1,044 |
|
Other assets | 882 |
| | — |
| | 882 |
|
Intangible assets | 15,980 |
| | — |
| | 15,980 |
|
Deferred revenue | (2,963 | ) | | — |
| | (2,963 | ) |
Accounts payable and accruals | (3,393 | ) | | (1,445 | ) | | (4,838 | ) |
Deferred income tax liability | (2,530 | ) | | 550 |
| | (1,980 | ) |
Goodwill | 10,555 |
| | 895 |
| | 11,450 |
|
Total consideration | $ | 31,300 |
| | $ | — |
| | $ | 31,300 |
|
(1) See Note 1 for restatement information.
The fair value of intangible assets is as follows:
|
| | | | | | |
(in thousands) | | Fair Value | | Life |
Backlog | | $ | 1,440 |
| | 1 year |
Customer relationships | | 8,960 |
| | 10 years |
Trade name | | 1,170 |
| | 7 years |
Developed technology | | 4,410 |
| | 9 years |
Total intangible assets | | $ | 15,980 |
| | |
ANTONE Acquisition
On May 15, 2012, the Company acquired certain assets and liabilities of ANTONE Wireless Corporation (ANTONE), including rights to ANTONE products, for $2.5 million cash, subject to an adjustment for working capital, plus contingent cash consideration of up to an additional $3.5 million (the ANTONE acquisition). The contingent consideration is based upon profitability of the acquired products for post-closing periods through June 30, 2016, and may be offset by working capital adjustments and indemnification claims. The acquisition included inventories, property and equipment, contract rights, customer relationships, technology, and certain specified operating liabilities that existed at the closing date. ANTONE products include high-performance tower-mounted amplifiers and cell-site antenna sharing products. The acquisition qualifies as a business combination and is accounted for using the acquisition method of accounting.
The results of ANTONE’s operations have been included in the Consolidated Financial Statements since the date of acquisition and are reported in the CSG operating segment. The Company incurred $0.1 million of related acquisition costs in fiscal year 2013 which were expensed as incurred and are reflected in general and administrative costs in the Consolidated Statement of Operations.
In accordance with the acquisition method of accounting for business combinations, the Company allocated the total purchase consideration transferred to identifiable tangible and intangible assets acquired and liabilities assumed at the acquisition date based on each element’s estimated fair value with the remaining unallocated amounts recorded as goodwill. Purchased intangibles are being amortized over their respective estimated useful lives. Goodwill represents the expected synergies and other benefits from this acquisition that relates to the Company’s market position, customer relationships and supply chain capabilities. All goodwill recorded on the ANTONE acquisition is expected to be amortized and deductible for U.S. federal and state income tax purposes.
The following table summarizes the fair values of the assets and liabilities assumed as of the May 15, 2012, acquisition date: |
| | | |
(in thousands) | |
Inventories | $ | 326 |
|
Deposit | 3 |
|
Intangible assets | 3,230 |
|
Liabilities | (612 | ) |
Goodwill | 2,086 |
|
Net assets acquired | $ | 5,033 |
|
Cash consideration transferred | $ | 2,524 |
|
Contingent consideration | 3,038 |
|
Working capital adjustment (shortfall) | (529 | ) |
Total consideration | $ | 5,033 |
|
The identifiable intangible assets include $2.8 million designated to technology and $0.4 million designated to customer relationships, each with estimated useful lives of 8 years. The Company calculated values based on the present value of the future estimated cash flows derived from operations attributable to technology and existing customer contracts and relationships. The $2.1 million of goodwill was evaluated with the Company's annual goodwill test in the fourth quarter of fiscal year 2013. The Company concluded that the goodwill was impaired and recorded an impairment charge in that quarter. See Note 5, Goodwill and Intangible Assets.
In fiscal year 2013, the Company recorded a $0.3 million warranty obligation for pre-acquisition sales made by ANTONE related to a specific product failure. See Note 7, Product Warranties.
Pro forma information all fiscal year 2014 acquisitions
The following unaudited summary information is presented on a consolidated pro forma basis as if the Kentrox and CSI acquisitions had occurred on April 1, 2012. The pro forma amounts reflect the accounting effects of the business combinations, including the application of the Company's accounting policies, amortization of intangible assets based on the estimated fair value and the impact of other fair value purchase accounting impacts such as inventory valuation step-up, deferred revenue reduction and the add back of interest expense. The pro forma results are based on historical information and is not necessarily indicative of the combined results had the acquisition been completed at April 1, 2012, nor are they indicative of future combined results.
|
| | | | | | | | |
(in thousands) | | 2014 (restated (1)) | | 2013 |
Consolidated pro forma revenue | | $ | 141,456 |
| | $ | 92,671 |
|
Consolidated pro forma operating income (loss) from continuing operations | | $ | 7,494 |
| | $ | (22,843 | ) |
(1) See Note 1 for restatement information.
Note 3. Summary of Significant Accounting Policies:
Business Combinations
The Company applies the guidance of ASC topic 805, Business Combinations. The Company recognizes the fair value of assets acquired and liabilities assumed in transactions; establishes the acquisition date fair value as the measurement objective for all assets acquired and liabilities assumed; expenses transaction and restructuring costs; and discloses the information needed to evaluate and understand the nature and financial effect of the business combination.
Cash and Cash Equivalents
Cash and cash equivalents consist of highly liquid investments with maturities of three months or less when purchased and include bank deposits, money market funds and debt instruments consisting of pre-refunded municipal bonds. The pre-refunded municipal bonds are classified as held-to-maturity and are carried at amortized cost. Money market funds are accounted for as available-for-sale securities under the requirements of ASC topic 320, Investments – Debt and Equity Securities (ASC 320).
Short-term Investments
Certificates of deposit held for investment with an original maturity greater than 90 days are carried at cost and reported as Short-term investments on the Consolidated Balance Sheets. The certificates of deposit are not debt securities. The Company also invests in debt instruments consisting of pre-refunded municipal bonds. The income and principal from these pre-refunded bonds are secured by an irrevocable trust holding U.S Treasury securities. The bonds have original maturities of greater than 90 days, but have remaining maturities of less than one year. The pre-refunded municipal bonds are classified as held-to-maturity and are carried at amortized cost.
Accounts Receivable and Allowance for Doubtful Accounts
Trade accounts receivable are recorded at the invoiced amount less payment discounts and estimated returns. The Company provides allowances for doubtful accounts related to accounts receivable for estimated losses resulting from the inability of its customers to make required payments. The Company takes into consideration the overall quality of the receivable portfolio along with specifically identified customer risks. In circumstances where the Company is aware of a specific customer’s inability to meet its financial obligations to the Company, the Company provides allowances for bad debts against amounts due to reduce the net recognized receivable to the amount it reasonably believes will be collected.
Concentrations of Credit Risk
Financial instruments that potentially subject the Company to concentrations of credit risk consist principally of cash equivalents, short-term investments, and trade receivables. The Company currently invests its excess cash in money market funds, certificates of deposit and debt investments consisting of pre-refunded municipal bonds that are secured by an irrevocable trust holding U.S. Treasury securities.
Earnings (Loss) per Share
The computation of basic net income (loss) per share is computed using the weighted-average number of common shares outstanding during the period. Diluted net income per share includes the number of additional common shares that would have been outstanding if the dilutive potential shares had been issued. In periods with a net loss, all common stock equivalents are excluded from the per share calculation; therefore, the basic loss per share equals the diluted loss per share.
Inventories and Inventory Valuation
Inventories are stated at the lower of first-in, first-out (FIFO) cost or market value. Market value is based upon an estimated average selling price reduced by estimated costs of disposal. Should actual market conditions differ from the Company’s estimates, the Company’s future results of operations could be materially affected. Reductions in inventory valuation are included in cost of goods sold in the accompanying Consolidated Statements of Operations. The Company reviews inventory for excess quantities and obsolescence based on its best estimates of future demand, product lifecycle status and product development plans. The Company uses historical information along with these future estimates to reduce the inventory cost basis. Subsequent changes in facts and circumstances do not result in the restoration or increase in that newly established cost basis. Prices anticipated for future inventory demand are compared to current and committed inventory values.
The components of inventories are as follows: |
| | | | | | | |
| March 31, |
(in thousands) | 2015 | | 2014 |
Raw materials | $ | 5,392 |
| | $ | 9,076 |
|
Work-in-process | 189 |
| | 209 |
|
Finished goods | 10,624 |
| | 14,771 |
|
Total inventories | $ | 16,205 |
| | $ | 24,056 |
|
Prepaid Expenses and Other Current Assets
Prepaid expenses and other current assets generally consisting of prepaid product royalty, prepaid maintenance agreements and prepaid rent, which are amortized as expense generally over the term of the underlying contract or estimated product life.
Land, Property and Equipment
Land, property and equipment are stated at cost, net of accumulated depreciation. Depreciation is computed using the straight-line method over the estimated useful lives of the assets, or for leasehold improvements, the shorter of the remaining lease term or the estimated useful life. Expenditures for major renewals and improvements that extend the useful life of property and equipment are capitalized. The following table shows estimated useful lives of property and equipment, as follows:
|
| | | |
Machinery and equipment | 5 | - | 7 years |
Office, computer and research equipment | 2 | - | 5 years |
Depreciation expense from continuing operations was $1.0 million, $0.6 million and $0.5 million for fiscal years 2015, 2014 and 2013, respectively. In accordance with ASC topic 360, Property, Plant and Equipment (ASC 360), the Company assesses all of its long-lived assets, including intangibles, for impairment when impairment indicators are identified. If the carrying value of an asset exceeds its undiscounted cash flows, an impairment loss may be necessary. An impairment loss is calculated as the difference between the carrying value and the fair value of the asset.
The Company acquired 16 acres of land with the Kentrox acquisition and sold 4 acres in April 2015 for $264,000. The land sold is classified as held-for-sale. The remaining 12 acres of land remains on the market. The Company concluded that a sale transaction for the remaining land is not probable within the next year therefore unsold land is reclassified as held and used. A land impairment of $0.1 million was recorded in general and administrative expense using the recent selling price in fiscal year 2015. No impairment losses were recorded in fiscal years 2014 or 2013.
Goodwill and Other Intangibles
Goodwill is the excess of the total purchase consideration transferred over the amounts allocated to identifiable assets acquired and liabilities assumed at the acquisition date. Goodwill is not amortized, but it is tested for impairment at the reporting unit level by first performing a qualitative approach to test goodwill for impairment to determine whether it is more likely than not that the fair value of a reporting unit is less than its carrying value. If it is concluded that this is the case, it is necessary to perform the two-step, quantitative, goodwill impairment test. Otherwise, the two-step goodwill impairment test is not required.
Goodwill is reviewed for impairment at least annually in accordance with ASC topic 350, Intangibles-Goodwill and Other (ASC 350), or when an event occurs or circumstances change between annual tests that would more likely than not reduce the fair value of the reporting unit below its carrying value. The Company performs its annual impairment test in the fourth quarter of each fiscal year and begins with a qualitative assessment to determine if it is more likely than not that the fair value of a reporting unit is less than its carrying value.
If the Company concludes that it is more likely than not that the fair value of a reporting unit is less than its carrying value, it is necessary to perform a two-step goodwill impairment test. The first step tests for impairment by applying fair value-based tests
at the reporting unit level. Fair value of a reporting unit is determined by using both an income approach and a market approach, because this combination is considered to produce the most reasonable indication of fair value in an orderly transaction between market participants. Under the income approach, the Company determines fair value based on estimated future cash flows of a reporting unit, discounted by an estimated weighted-average cost of capital, which reflects the level of risk inherent in a reporting unit and its associated estimates of future cash flows as well as the rate of return an experienced investor might expect to earn. Discount rate assumptions are considered Level 3 inputs in the fair value hierarchy defined in ASC topic 820, Fair Value Measurements and Disclosures (ASC 820). Under the market approach, the Company utilizes valuation multiples derived from publicly available information for comparable companies to provide an indication of how much a knowledgeable investor in the marketplace might be willing to pay for a company. The second step (if necessary) measures the amount of impairment by applying fair-value-based tests to individual assets and liabilities within each reporting unit.
If the Company concludes that it is more likely than not that the fair value of an indefinite-lived intangible asset is less than its carrying value, a quantitative fair value assessment is performed and compared to the carrying value. If the fair value is less than the carrying value, impairment is recorded.
Intangible assets with determinable lives are amortized on a straight-line basis over their respective estimated useful lives. If the Company were to determine that a change to the remaining estimated useful life of an intangible asset was necessary, then the remaining carrying amount of the intangible asset would be amortized prospectively over that revised remaining useful life. On an ongoing basis, the Company reviews intangible assets with a definite life and other long-lived assets other than goodwill for impairment whenever events and circumstances indicate that carrying values may not be recoverable. If such events or changes in circumstances occur, the Company will recognize an impairment loss if the undiscounted future cash flow expected to be generated by the asset is less than the carrying value of the related asset. Any impairment loss would adjust the asset to its implied fair value.
The Company determined there were triggering events and performed quantitative analysis of goodwill in fiscal year 2015 and concluded all goodwill as impaired. See Note 5, Goodwill and Intangibles for further discussion of goodwill and intangible evaluations.
Revenue Recognition and Deferred Revenue
The Company's revenue is derived from the sale of products, software, and services. The Company records revenue from product sales transactions when title and risk of loss are passed to the customer, there is persuasive evidence of an arrangement for sale, delivery has occurred and/or services have been rendered, the sales price is fixed or determinable, and collectability is reasonably assured.
Revenue recognition on equipment where software is incidental to the product as a whole, or where software is essential to the equipment’s functionality and falls under software accounting scope exceptions, generally occurs when products are shipped, risk of loss has transferred to the customer, objective evidence exists that customer acceptance provisions have been met, no significant obligations remain, collection is reasonably assured and warranty can be estimated.
Revenue recognition where software that is more than incidental to the product as a whole or where software is sold on a standalone basis is recognized when the software is delivered and ownership and risk of loss are transferred.
The Company also recognizes revenue from deployment services, maintenance agreements, training and professional services. Deployment services revenue results from installation of products at customer sites. Deployment services, which generally occur over a short time period, are not services required for the functionality of products, because customers do not have to purchase installation services from the Company, and may install products themselves, or hire third parties to perform the installation services. Revenue for deployment services, training and professional services are recognized upon completion and acceptance. Revenue from maintenance agreements is recognized ratably over the service period.
When a multiple element arrangement exists, the fee from the arrangement is allocated to the various deliverables so that the proper amount can be recognized as revenue as each element is delivered. Based on the composition of the arrangement, the Company analyzes the provisions of the accounting guidance to determine the appropriate model that is applied towards accounting for the multiple element arrangement. If the arrangement includes a combination of elements that fall within different applicable guidance, the Company follows the provisions of the hierarchal literature to separate those elements from each other and apply the relevant guidance to each.
If deliverables do not fall within the software revenue recognition guidance, the fair value of each element is established using the relative selling price method, which requires the Company to use vendor-specific objective evidence (VSOE), reliable third-party objective evidence or management's best estimate of selling price, in that order.
If deliverables fall within the software revenue recognition guidance, the fee is allocated to the various elements based on VSOE of fair value. If sufficient VSOE of fair value does not exist for the allocation of revenue to all the various elements in a multiple element arrangement, all revenue from the arrangement is deferred until the earlier of the point at which such
sufficient VSOE of fair value is established or all elements within the arrangement are delivered. If VSOE of fair value exists for all undelivered elements, but does not exist for one or more delivered elements, the arrangement consideration is allocated to the various elements of the arrangement using the residual method of accounting. Under the residual method, the amount of the arrangement consideration allocated to the delivered elements is equal to the total arrangement consideration less the aggregate fair value of the undelivered elements. Using this method, any potential discount on the arrangement is allocated entirely to the delivered elements, which ensures that the amount of revenue recognized at any point in time is not overstated. Under the residual method, if VSOE of fair value exists for the undelivered element, generally maintenance, the fair value of the undelivered element is deferred and recognized ratably over the term of the maintenance contract, and the remaining portion of the arrangement is recognized as revenue upon delivery, which generally occurs upon delivery of the product.
The Company has established VSOE based on its historical pricing practices. The application of VSOE methodologies requires judgment, including the identification of individual elements in multiple element arrangements and whether there is VSOE of fair value for some or all elements.
The Company’s product return policy allows customers to return unused equipment for partial credit if the equipment is non-custom product, returned within specified time limits, and currently being manufactured and sold. Credit is not offered on returned products that are no longer manufactured and sold.
The Company records revenue net of taxes in accordance with ASC topic 605, Revenue Recognition (ASC 605).
Shipping and Handling
Freight billed to customers is recorded as revenue. Effective April 1, 2014, the Company made a voluntary change in accounting principle to classify shipping and handling costs associated with the distribution of finished product to our customers as cost of revenue (previously recorded in sales and marketing expense). The Company recorded costs related to shipping and handling expense of $0.9 million, $1.4 million and $0.7 million for the fiscal years 2015, 2014 and 2013, respectively.
Product Warranties
Most of the Company’s products carry a limited warranty of up to seven years. The Company accrues for estimated warranty costs as products are shipped based on historical sales and cost of repair or replacement trends relative to sales. See Note 7 for further discussion of the Company’s product warranties.
Research and Development Costs
Engineering and product research and development costs are charged to expense as incurred.
Stock-based Compensation
The Company recognizes stock-based compensation expense for all employee stock-based payments based upon the fair value on the awards grant date over the requisite service period. If the awards are performance based, the Company must estimate future performance attainment to determine the number of awards expected to vest. Determining the fair value of equity-based options requires the Company to estimate the expected volatility of its stock, the risk-free interest rate, expected option term, expected dividend yield and expected forfeitures. See Note 9 for further discussion of the Company’s stock-based compensation plans.
Fair Value Measurements
The Company accounts for the fair value of assets and liabilities in accordance with ASC 820. ASC 820 defines fair value and establishes a framework for measuring fair value as required by other accounting pronouncements. See Note 13 for further discussion of the Company’s fair value measurements.
Foreign Currency
The Company’s primary foreign currency exposure is to changes in exchange rates for the U.S. dollar versus the Australian and Canadian dollar and the related effects on receivables and payables denominated in those currencies. The functional currency for Noran Tel, the Company's foreign subsidiary located in Canada is the U. S. dollar. The Company records transaction gains (losses) for fluctuations on foreign currency rates on accounts receivable, accounts payable, and cash as a component of other income (expense), net on the Consolidated Statements of Operations.
Income Taxes
The Company accounts for income taxes under the provisions of ASC topic 740, Income Taxes (ASC 740). ASC 740 requires an asset and liability based approach in accounting for income taxes. Deferred income tax assets, including net operating loss (NOL) and certain tax credit carryovers and liabilities, are recorded based on the differences between the financial statement
and tax bases of assets and liabilities, applying enacted statutory tax rates in effect for the year in which the tax differences are expected to reverse. Valuation allowances are provided against deferred tax assets which are assessed as not likely to be realized. On a quarterly basis, management evaluates the recoverability of deferred tax assets and the need for a valuation allowance. This evaluation requires the use of estimates and assumptions and considers all positive and negative evidence and factors, such as the scheduled reversal of temporary differences, the mix of earnings in the jurisdictions in which the Company operates, and prudent and feasible tax planning strategies. Deferred tax assets and liabilities are adjusted for the effects of changes in tax laws and rates on the dates of enactment. The Company accounts for unrecognized tax benefits based upon its assessment of whether a tax benefit is more likely than not to be sustained upon examination by tax authorities. The Company reports a liability for unrecognized tax benefits resulting from unrecognized tax benefits taken or expected to be taken in a tax return and recognizes interest and penalties, if any, related to its unrecognized tax benefits in income tax expense. See Note 4 for further discussion of the Company’s income taxes.
Recently Issued Accounting Pronouncements
In August 2014, the FASB issued ASU No. 2014-15, Disclosure of Uncertainties about an Entity’s Ability to Continue as a Going Concern (ASU 2014-15), to provide guidance on management’s responsibility in evaluating whether there is substantial doubt about a company’s ability to continue as a going concern and to provide related footnote disclosures. The amendments in this update are effective for the annual period ending after December 15, 2016, and for annual periods and interim periods thereafter. Early application is permitted. The Company does not expect the adoption of ASU 2014-15 to have a significant impact on its Consolidated Financial Statements or related disclosures.
In May 2014, the FASB issued ASU No. 2014-09, Revenue From Contracts With Customers (ASU 2014-09), that outlines a single comprehensive model for entities to use in accounting for revenue arising from contracts with customers and supersedes most current revenue recognition guidance, including industry-specific guidance. The ASU is based on the principle that an entity should recognize revenue to depict the transfer of goods or services to customers in an amount that reflects the consideration to which the entity expects to be entitled in exchange for those goods or services. The ASU also requires additional disclosure about the nature, amount, timing and uncertainty of revenue and cash flows arising from customer contracts, including significant judgments and changes in judgments and assets recognized from costs incurred to fulfill a contract. Entities have the option of using either a full retrospective or a modified retrospective approach for the adoption of the new standard. The ASU becomes effective for annual reporting periods beginning after December 15, 2016, including interim periods within that reporting period; early adoption is not permitted. The Company is currently assessing the impact that ASU 2014-09 will have on its Consolidated Financial Statements.
Note 4. Income Taxes:
The Company utilizes the liability method of accounting for income taxes and deferred taxes which are determined based on the differences between the financial statements and tax bases of assets and liabilities given the provisions of the enacted tax laws. In assessing the realizability of the deferred tax assets, the Company considered whether it is more likely than not that some portion or all of the deferred tax assets will not be realized through the generation of future taxable income. In making this determination, the Company assessed all of the evidence available at the time including recent earnings, forecasted income projections, and historical financial performance. The Company has fully reserved deferred tax assets as a result of this assessment.
The income tax expenses (benefits) from continuing operations are summarized as follows:
|
| | | | | | | | | | | |
| Fiscal Year Ended March 31, |
(in thousands) | 2015 | | 2014 (as restated (1)) | | 2013 |
Federal: | |
Current | $ | — |
| | $ | 6 |
| | $ | — |
|
Deferred | 13 |
| | (6,683 | ) | | 24,578 |
|
| 13 |
| | (6,677 | ) | | 24,578 |
|
State: | | | | | |
Current | (31 | ) | | 433 |
| | 2 |
|
Deferred | (87 | ) | | (1,589 | ) | | 4,797 |
|
| (118 | ) | | (1,156 | ) | | 4,799 |
|
Foreign: | | | | | |
Current | 31 |
| | 56 |
| | (8 | ) |
Deferred | (127 | ) | | (133 | ) | | 23 |
|
| (96 | ) | | (77 | ) | | 15 |
|
Total | $ | (201 | ) | | $ | (7,910 | ) | | $ | 29,392 |
|
(1) See Note 1 for restatement information.
The statutory federal income tax rate is reconciled to the Company's effective income tax rates below:
|
| | | | | | | | |
| Fiscal Year Ended March 31, |
| 2015 (as restated (1)) | | 2014 (as restated (1)) | | 2013 |
Statutory federal income tax rate | 34.0 | % | | 34.0 | % | | 34.0 | % |
Meals and entertainment | (0.1 | ) | | (1.5 | ) | | (0.2 | ) |
State income tax, net of federal tax effect | 3.8 |
| | 2.4 |
| | 3.1 |
|
Valuation allowance | (17.4 | ) | | 192.5 |
| | (256.1 | ) |
Goodwill impairment | (19.0 | ) | | — |
| | (2.1 | ) |
Deferred tax adjustments | (0.1 | ) | | 8.3 |
| | 1.4 |
|
Foreign tax credit | — |
| | 3.3 |
| | (0.3 | ) |
Equity compensation | (0.8 | ) | | (6.4 | ) | | (0.6 | ) |
Capitalized transaction costs | — |
| | (2.7 | ) | | — |
|
Other | (0.1 | ) | | (3.2 | ) | | (2.7 | ) |
Effective income tax rate | 0.3 | % | | 226.7 | % | | (223.5 | )% |
(1) See Note 1 for restatement information.
Components of the net deferred income tax assets are as follows: |
| | | | | | | |
| March 31, |
(in thousands) | 2015 (as restated (1)) | | 2014 (as restated (1)) |
Deferred income tax assets: | |
Allowance for doubtful accounts | $ | 17 |
| | $ | 33 |
|
Alternative minimum tax credit carryforward | 697 |
| | 697 |
|
Foreign tax credit carryforward | 824 |
| | 785 |
|
Depreciation | 1,025 |
| | 940 |
|
Deferred revenue | 1,227 |
| | 950 |
|
Compensation accruals | 887 |
| | 2,323 |
|
Inventory reserves | 3,492 |
| | 1,903 |
|
Warranty reserves | 196 |
| | 92 |
|
Net operating loss carryforward | 35,380 |
| | 29,510 |
|
Restructuring reserve | 1,048 |
| | — |
|
Other | 1,679 |
| | 1,413 |
|
Gross deferred tax assets | 46,472 |
| | 38,646 |
|
Valuation allowance | (39,667 | ) | | (29,414 | ) |
Net deferred income tax assets | 6,805 |
| | 9,232 |
|
Deferred income tax liabilities: | | | |
Inventory step-up | — |
| | (379 | ) |
Intangibles and goodwill | (6,851 | ) | | (9,026 | ) |
Net deferred income tax liabilities | $ | (46 | ) | | $ | (173 | ) |
(1) See Note 1 for restatement information.
Classified in Consolidated Balance Sheets as follows:
|
| | | | | | | |
| March 31, |
(in thousands) | 2015 (as restated (1)) | | 2014 (as restated (1)) |
Deferred income tax assets | $ | 1,043 |
| | $ | 1,449 |
|
Deferred income tax liability | (1,089 | ) | | (1,622 | ) |
Net deferred income tax liabilities | $ | (46 | ) | | $ | (173 | ) |
(1) See Note 1 for restatement information.
In addition to the deferred tax assets listed in the table above, the Company has $1.5 million and $1.3 million of unrecorded tax benefits at March 31, 2015, and 2014, respectively, primarily attributable to the difference between the amount of the financial statement expense and the allowable tax deduction for stock issued under the Company’s stock compensation plans. Although not recognized for financial reporting purposes, this unrecognized tax benefit is available to reduce future income and is incorporated as a reduction to the Company’s federal and state NOL carryforwards, which are discussed below.
In fiscal year 2015, the Company continues to maintain a full valuation allowance on deferred tax assets. The Company recorded an income tax benefit of $0.2 million that resulted from foreign tax and state tax based on gross margin.
In fiscal year 2014, the Company continued to fully reserve deferred tax assets. The Company acquired Kentrox and CSI in stock transactions. Deferred tax liabilities of $8.3 million resulted from the acquisitions relating primarily to acquired intangible assets. The Company's anticipated ability to realize deferred tax assets from the reversal of these deferred tax liabilities resulted in a reversal of valuation allowance. Income tax expense, excluding the impact of the acquisitions noted above, was $0.4 million primarily from state income tax expense in non-unitary states and state taxes based on gross margin, not taxable income.
In fiscal year 2013, the Company considered both the positive and negative evidence available to assess the realizability of its deferred tax assets. The Company considered negative factors which included recent losses and a forecasted three-year cumulative loss position, as well as positive evidence consisting primarily of projected future earnings. The Company concluded that the negative evidence outweighed the objectively verifiable positive evidence. As a result, the Company increased the valuation allowance against domestic deferred income tax assets by $34.0 million, which taken together with the
liability for uncertain tax positions, had the effect of reserving in full all of the Company's deferred tax assets as of March 31, 2013.
The Company has, on a tax effected basis, approximately $1.5 million in tax credit carryforwards and $30.9 million of federal net operating loss carryforwards that are available to offset taxable income in the future. The tax credit carryforwards will begin to expire in fiscal year 2022. The federal net operating loss carryforwards begin to expire in fiscal year 2023. State net operating loss carryforwards, on a tax effected basis and net of federal tax benefits, are $6.0 million. The state net operating loss carryforwards begin to expire in fiscal year 2016.
The Company accounts for uncertainty in income taxes under ASC 740, which prescribes a recognition threshold and measurement of a tax position taken or expected to be taken in a tax return. ASC 740 also provides guidance on derecognition, classification, interest and penalties, accounting in interim periods, disclosure and transition.
A reconciliation of the beginning and ending balances of the total amounts of unrecognized tax benefits for fiscal years 2014 and 2015 is as follows:
|
| | | |
(in thousands) | |
Unrecognized tax benefits at March 31, 2013 | $ | 2,768 |
|
Additions from acquisitions | 186 |
|
Additions based on positions related to fiscal year 2014 | — |
|
Additions for tax positions of years prior to fiscal year 2014 | 1 |
|
Reductions for tax positions of years prior to fiscal year 2014 | — |
|
Reductions as a result of expirations of applicable statutes of limitations | — |
|
Settlements | — |
|
Unrecognized tax benefits at March 31, 2014 | $ | 2,955 |
|
Additions based on positions related to fiscal year 2015 | — |
|
Additions for tax positions of years prior to fiscal year 2015 | 1 |
|
Reductions for tax positions of years prior to fiscal year 2015 | — |
|
Reductions as a result of expirations of applicable statutes of limitations | — |
|
Settlements | — |
|
Unrecognized tax benefits at March 31, 2015 | $ | 2,956 |
|
If the unrecognized tax benefit balances at March 31, 2015, and 2014, were recognized, it would affect the effective tax rate.
The Company recognized interest and penalties of $6,000, $3,000 and $12,000 as a component of income tax expense as of March 31, 2015, 2014, and 2013, respectively. As of March 31, 2015, and 2014, accrued interest and penalties were $1,000 and $1,000, respectively.
The Company files its tax returns as prescribed by the tax laws of the jurisdictions in which it operates.
With few exceptions, the major jurisdictions subject to examination by the relevant taxable authorities, and open tax years, stated as the Company's fiscal years, are as follows: |
| | | |
Jurisdiction | Open Tax Years |
U.S. Federal | 2011 | - | 2014 |
U.S. State | 2010 | - | 2014 |
Foreign | 2010 | - | 2014 |
Note 5. Goodwill and Intangible Assets:
The Company has recorded intangible assets, such as goodwill, trademark, developed technology, non-compete agreements, backlog, and customer relationships, and accounts for these in accordance with ASC 350. ASC 350 requires an annual test of goodwill and indefinite-lived assets for impairment, unless circumstances dictate more frequent assessments.
Goodwill
Goodwill resulted from the fiscal year 2013 ANTONE acquisition and the fiscal year 2014 Kentrox and CSI acquisitions.
Fiscal Year 2013 Evaluation
The Company performed its annual evaluation of goodwill for the combined reporting units consisting of Noran Tel and Westell on January 1, 2013 and determined that the full carrying amount of goodwill created from the acquisition of ANTONE of $2.9 million was impaired.
Fiscal Year 2014 Evaluation
The Company performed its annual evaluation of goodwill as of January 1, 2014. The Company assessed whether it was more likely than not that fair value of the Kentrox reporting unit, which made up all of the goodwill on that date, was less than its carrying amount including goodwill by considering the following factors: macroeconomic conditions, industry and market considerations, financial market considerations, key personnel, share price and overall financial performance. Based on these factors, the Company determined no indicators of impairment were present and therefore it was not necessary to perform a two-step goodwill impairment test.
Fiscal Year 2015 Evaluations
During fiscal year 2015, the Company experienced triggering events in the second and third quarters that resulted in the Company testing its goodwill for impairment. In the second quarter, continued deterioration in macroeconomic conditions, decline in market capitalization, continued operating losses, lower forecasted revenue and cash flows, and the overall decline in the Company’s net sales during the quarter, indicated that it was more likely than not that the fair value of certain reporting units was reduced to below the respective carrying amount. As a result, in connection with the preparation of the financial statements for the quarter ended September 30, 2014, the Company considered these factors as a triggering event and performed an interim evaluation of goodwill using a two-step quantitative assessment. The first step compared the fair value of the reporting units with the carrying value as of September 1, 2014. The IBW reporting unit's fair value was approximately 13% greater than its carrying value at that time. The IBW reporting unit had a goodwill balance of $20.5 million as of September 30, 2014. The CSG reporting unit's fair value was below its carrying value therefore the Company completed the second step of the evaluation, which compares the implied fair value of goodwill with the carrying value of goodwill to determine the amount of the impairment loss. Fair value of the reporting unit was determined using a combination of income and market approaches. Determining the fair value of the reporting unit and the allocation of that fair value to individual assets and liabilities within the reporting unit to determine the implied fair value of the goodwill is judgmental in nature and requires the use of significant estimates and assumptions. These estimates and assumptions include discount rate, terminal growth rate, selection of peer group companies and control premium applied as well as forecasts of revenue growth rates, gross margins, operating margins, and working capital requirements. The allocation requires analysis to determine the fair value of assets and liabilities including, among others, customer relationships, trade names, and property and equipment. Any changes in the judgments, estimates, or assumptions used could produce significantly different results. As a result of that goodwill impairment evaluation, a goodwill impairment charge of $11.5 million was recorded in the quarter ended September 30, 2014. This charge was comprised of 100% of the goodwill for the CSG segment.
During the third quarter ended December 31, 2014, due to the continuing decline in the market price of the Company’s stock, the market capitalization of the Company fell further below the carrying value, indicating the need to perform another interim evaluation of goodwill. As a result, in connection with preparation of the financial statements for the quarter ended December 31, 2014, the Company considered these factors as a triggering event and performed an interim evaluation of goodwill using a two-step quantitative assessment. The first step compared the fair value of the IBW reporting unit with the carrying value as of December 31, 2014, and determined that the unit's fair value was below its carrying value. Due to the timing and complexity of the second step of the evaluation, the Company was unable to finalize the amount of the impairment prior to the filing of Form 10-Q for the quarter ended December 31, 2014. The Company estimated that the goodwill related to the IBW segment was fully impaired and recorded an impairment charge of $20.5 million in the third quarter ended December 31, 2014. The Company finalized the second step of the goodwill assessment in the quarter ended March 31, 2015, with no changes to the third quarter estimate.
Changes in the carrying amounts of goodwill by reporting units are as follows:
|
| | | | | | | | | | | | | | | | | | | |
(in thousands) | Kentrox (as restated (1)) | | CSI | | CSG (as restated (1)) | | IBW | | Total (as restated (1)) |
March 31, 2013 balance, net | — |
| | — |
| | — |
| | — |
| | — |
|
Business acquisition (as adjusted (2)) | 11,450 |
| | 20,547 |
| | — |
| | — |
| | 31,997 |
|
March 31, 2014 balance, net (as adjusted (2)) | 11,450 |
| | 20,547 |
| | — |
| | — |
| | 31,997 |
|
Change in reporting units | (11,450 | ) | | (20,547 | ) | | 11,450 |
| | 20,547 |
| | — |
|
Goodwill impairment | — |
| | — |
| | (11,450 | ) | | (20,547 | ) | | (31,997 | ) |
March 31, 2015 balance, net | $ | — |
| | $ | — |
| | $ | — |
| | $ | — |
| | $ | — |
|
(1) See Note 1 for restatement information.
(2) Certain amounts have been adjusted to reflect measurement period adjustments related to the CSI acquisition (see Note 2).
Intangible Assets
Intangible assets include customer relationships, trade names, developed technology and other intangibles. Intangible assets with determinable lives are amortized over the estimated useful lives of the assets. These intangible assets are reviewed for impairment whenever events or changes in circumstances indicate that the carrying amount of such assets may not be recoverable. Determination of recoverability is based on an estimate of undiscounted future cash flows resulting from the use of the asset and its eventual disposition. If the carrying amount of an asset exceeds its estimated future undiscounted cash flows, an impairment loss is recorded for the excess of the asset’s carrying amount over its fair value. Intangible asset impairment charges are presented in intangible amortization on the Consolidated Statements of Operations.
In fiscal year 2014, the Company determined that the Noran Tel trade name would be phased out over a one year period and therefore started to amortize the intangible asset over its remaining useful life. Indicators of impairment were present with the declining revenue from legacy products in the Westell segment and the Company performed an evaluation to test intangible assets related to those products for recoverability. The Company concluded that the transmission product technology intangible acquired with the Noran Tel acquisition was impaired. A $0.2 million charge resulted recorded in intangible amortization expense to reduce the value of the asset to $0.2 million which will be amortized over the remaining useful life of two years.
In fiscal year 2015, due to the indications of impairment noted above, the Company reviewed finite-lived assets for impairment. The review resulted in a $0.1 million impairment loss in the CSG segment.
The following table presents details of the Company’s intangibles from historical acquisitions, including the fiscal year 2013 ANTONE acquisition and fiscal year 2014 Kentrox and CSI acquisitions:
|
| | | | | | | | | | | | | | | | | | |
| | March 31, 2015 | | March 31, 2014 (adjusted (1)) |
| | Gross Carrying Amount | | Accumulated Amortization and Impairment | | Net Carrying Amount | | Gross Carrying Amount | | Accumulated Amortization and Impairment | | Net Carrying Amount |
Backlog | | 1,530 |
| | (1,530 | ) | | — |
| | 1,530 |
| | (1,530 | ) | | — |
|
Customer relationships | | 24,867 |
| | (7,917 | ) | | 16,950 |
| | 24,867 |
| | (4,416 | ) | | 20,451 |
|
Product technology | | 45,234 |
| | (37,370 | ) | | 7,864 |
| | 45,234 |
| | (35,370 | ) | | 9,864 |
|
Non-compete | | 510 |
| | (276 | ) | | 234 |
| | 510 |
| | (21 | ) | | 489 |
|
Trade name and trademark | | 1,848 |
| | (954 | ) | | 894 |
| | 1,848 |
| | (333 | ) | | 1,515 |
|
Total finite-lived intangible assets, net | | 73,989 |
| | (48,047 | ) | | 25,942 |
| | 73,989 |
| | (41,670 | ) | | 32,319 |
|
(1) Certain amounts have been adjusted to reflect measurement period adjustments related to the CSI acquisition (see Note 2).
The finite-lived intangibles are being amortized over periods of two to ten years using either a straight line method or the consumption period based on expected cash flows from the underlying intangible asset. Finite-lived intangible amortization and impairment expense from continuing operations was $6.4 million, $4.9 million and $0.9 million in fiscal years 2015, 2014 and 2013. The following is the expected future amortization by fiscal year:
|
| | | | | | | | | | | | | | | | | | | | | | | |
(in thousands) | 2016 | | 2017 | | 2018 | | 2019 | | 2020 | | thereafter |
Intangible amortization expense | $ | 5,365 |
| | $ | 4,486 |
| | $ | 3,958 |
| | $ | 3,679 |
| | $ | 2,952 |
| | $ | 5,502 |
|
Note 6. Commitments and Contingencies:
Obligations
The Company leases an 179,000 square foot corporate facility in Aurora, Illinois. This location houses corporate administration, sales, marketing and the CSG segment product distribution, engineering and manufacturing pursuant to a lease that originated in 1997 and runs through September, 2017. The rental payments are currently $2.0 million a year and increase 2% every other year. In accordance with FASB Technical Bulletin 88-1, Issues Related to Accounting of Leases, as codified in ASC topic 840, Leases (ASC 840), the Company recorded a long-term deferred lease liability of $286,000 and $417,000 presented in other long-term liabilities and a short-term deferred lease liability of $155,000 and $134,000 presented in accrued expenses on the Consolidated Balance Sheets as of March 31, 2015, and 2014, respectively, to account for the straight-line impact on the rental payments. The CSG segment leases an engineering office, approximately 2,500 square feet located in Regina, Canada. The CSG segment also leases a 9,465 square foot engineering and service center in Dublin, Ohio, which runs through 2019. The IBW segment leases a 16,932 square foot manufacturing and distribution center and a 19,525 square foot office in Manchester, New Hampshire. The IBW segment leases runs through 2018. The leases require the Company to pay utilities, insurance and real estate taxes on the facilities. Total rent expense for all facilities was $3.1 million, $2.8 million and $2.3 million for fiscal years 2015, 2014 and 2013, respectively. In fiscal years 2015, 2014 and 2013, rent expense was offset by $0.1 million, $0.1 million and $0.1 million of sublease income, respectively.
Purchase obligations consist of inventory that arises in the normal course of business operations. Future obligations and commitments as of March 31, 2015 consisted of the following:
|
| | | | | | | | | | | | | | | | | | | | | | | | | | | |
| Payments due by fiscal year |
(in thousands) | 2016 | | 2017 | | 2018 | | 2019 | | 2020 | | Thereafter | | Total |
Purchase obligations (1) | $ | 9,030 |
| | $ | — |
| | $ | — |
| | $ | — |
| | $ | — |
| | $ | — |
| | $ | 9,030 |
|
Future minimum lease payments for operating leases | 2,638 |
| | 2,635 |
| | 1,023 |
| | 189 |
| | 58 |
| | — |
| | 6,543 |
|
Contingent consideration | 1,184 |
| | 400 |
| | — |
| | — |
| | — |
| | — |
| | 1,584 |
|
Future obligations and commitments | $ | 12,852 |
| | $ | 3,035 |
| | $ | 1,023 |
| | $ | 189 |
| | $ | 58 |
| | $ | — |
| | $ | 17,157 |
|
(1) For the year ended March 31, 2015, the Company recorded a net loss on firm purchase commitments of $590,000.
Litigation and Contingency Reserves
The Company and its subsidiaries are involved in various assertions, claims, proceedings and requests for indemnification concerning intellectual property, including patent infringement suits involving technologies that may be incorporated in the Company’s products, which are being handled and defended in the ordinary course of business. These matters are in various stages of investigation and litigation, and they are being vigorously defended. Although the Company does not expect that the outcome in any of these matters, individually or collectively, will have a material adverse effect on its financial condition or results of operations, litigation is inherently unpredictable. Therefore, judgments could be rendered, or settlements entered, that could adversely affect the Company’s operating results or cash flows in a particular period. The Company routinely assesses all of its litigation and threatened litigation as to the probability of ultimately incurring a liability, and it records its best estimate of the ultimate loss in situations where it assesses the likelihood of loss as probable. As of March 31, 2015, and March 31, 2014, the Company has not recorded any contingent liability attributable to existing litigation.
As of March 31, 2015, and March 31, 2014, the Company had total contingency reserves of $0.4 million and $0.7 million, respectively, related to the discontinued operations of ConferencePlus. The contingency reserves are classified as accrued expenses on the Consolidated Balance Sheets. In fiscal year 2015, $0.2 million of the reserve was reversed and is presented in Income from Discontinued Operations. In fiscal year 2014, the Company paid $1.1 million relating to an indemnification claim. See Note 1, Basis of Presentation.
In fiscal year 2013, the Company resolved, through arbitration, a dispute with NETGEAR regarding an interpretation of the sales agreement covering the CNS asset sale at a cost of $0.9 million. As of March 31, 2012, the Company had a $0.4 million contingency reserve for this claim and recorded an additional expense of $0.5 million during fiscal year 2013. All amounts have been paid as of March 31, 2013.
Additionally, the Company has contingent cash consideration payable related to the ANTONE acquisition. The ANTONE contingent consideration becomes payable based upon the profitability of the acquired products for post-closing periods through June 30, 2016, and is offset by working capital adjustments and certain indemnification claims. The maximum earn-out that could be paid before offsets is $3.5 million. As of March 31, 2015 and March 31, 2014, the fair value of the contingent
consideration liability, after an offset for a working capital adjustment and an indemnification claim for warranty obligations, is $1.6 million and $2.6 million, respectively. In fiscal 2015, the Company made contingent consideration payments of $1.1 million. See Note 2, Note 7 and Note 13.
Note 7. Product Warranties:
The Company’s products in the CSG segment carry a limited warranty ranging from one to seven years and one to five years for the product within the IBW segment. The specific terms and conditions of those warranties vary depending upon the customer and the product sold. Factors that enter into the estimate of the Company’s warranty reserve include: the number of units shipped historically, anticipated rates of warranty claims, and cost per claim. The Company periodically assesses the adequacy of its recorded warranty liability and adjusts the reserve as necessary. In fiscal year 2013, the Company recorded a $303,000 warranty obligation for pre-acquisition sales made by ANTONE related to a specific product failure. A corresponding indemnification claim for this warranty obligation was adjusted in the valuation of the contingent consideration related to the ANTONE acquisition (see Note 2, Note 6, and Note 13). The current portions of the warranty reserve were $383,000 and $286,000 as of March 31, 2015, and 2014, respectively, and are presented on the Consolidated Balance Sheets as accrued expenses. The long-term portions of the warranty reserve were $122,000 and $42,000 as of March 31, 2015, and 2014, respectively, and are presented on the Consolidated Balance Sheets as other long-term liabilities.
The following table presents the changes in our product warranty reserve:
|
| | | | | | | | | | | |
| Fiscal Year Ended March 31, |
(in thousands) | 2015 | | 2014 | | 2013 |
Total product warranty reserve at the beginning of the period | $ | 328 |
| | $ | 152 |
| | $ | 243 |
|
Warranty reserves from business acquisitions | — |
| | 149 |
| | 25 |
|
Specific pre-acquisition ANTONE product warranty in excess of acquired limit | — |
| | — |
| | 303 |
|
Warranty expense (reversal) | 446 |
| | 183 |
| | (45 | ) |
Utilization | (269 | ) | | (156 | ) | | (374 | ) |
Total product warranty reserve at the end of the period | $ | 505 |
| | $ | 328 |
| | $ | 152 |
|
Note 8. Capital Stock and Stock Restriction Agreements:
Capital Stock Activity
The Board of Directors has the authority to issue up to 1,000,000 shares of preferred stock in one or more series and to fix the rights, preferences, privileges and restrictions thereof, including dividend rights, conversion rights, voting rights, terms of redemption, liquidation preferences, sinking fund terms and the number of shares constituting any series or the designation of such series, without any further vote or action by stockholders.
Share Repurchase Programs
On August 29, 2011, the Board of Directors authorized an additional share repurchase program whereby the Company may repurchase up to an aggregate of $20.0 million of its outstanding Class A Common Stock (the August 2011 authorization).
In fiscal year 2013, the Company repurchased 5.7 million shares under the August 2011 authorization with a weighted-average per share purchase price of $2.20. In fiscal years 2014 and 2015, there were no repurchases under the August 2011 authorization. As of March 31, 2015, there was approximately $0.1 million remaining for additional share repurchases under this authorization.
Additionally, in fiscal years 2015, 2014 and 2013, the Company repurchased 335,890 shares, 161,699 shares and 133,816 shares, respectively, from employees that were withheld to satisfy the minimum statutory tax withholding obligations on the vesting of restricted stock units and performance-based restricted stock units. These repurchases, which are not included in the authorized share repurchase programs, had a weighted-average purchase price of $2.57, $2.22 and $2.32, respectively.
Stock Restriction Agreements
The members of the Penny family (principal stockholders) have a Stock Transfer Restriction Agreement which prohibits, with limited exceptions, such members from transferring their Class B Common Stock acquired prior to November 30, 1995, without first offering such stock to the other members of the Penny family. If converted, Class B stock converts on a one-for-
one basis into shares of Class A Common Stock upon a transfer. As of March 31, 2015, a total of 13,937,150 shares of Class B Common Stock are subject to this Stock Transfer Restriction Agreement.
Voting Rights
The Company’s Common Stock is divided into two classes. Class A Common Stock is entitled to one vote per share while Class B Common Stock is entitled to four votes per share. As of May 14, 2015, as trustees the Voting Trust, containing common stock held for the benefit of the Penny family, Robert C. Penny III, Robert W. Foskett and Patrick J. McDonough, Jr. have the exclusive power to vote over 50.5% of the votes entitled to be cast by the holders of our common stock. Certain Penny family members also own, or are beneficiaries of trusts that own shares outside of the Voting Trust. As trustees of the Voting Trust and other trusts, Messrs. Penny, Foskett and McDonough, Jr. control 54.4% of the voting power of the Company’s outstanding stock and therefore effectively control the Company.
Shares Issued and Outstanding
The following table summarizes Common Stock transactions for fiscal years 2013, 2014 and 2015:
|
| | | | | | | | |
| Common Shares Outstanding | | |
(in thousands) | Class A | | Class B | | Treasury |
Total shares outstanding, March 31, 2012 | 50,429 |
| | 13,937 |
| | (11,181 | ) |
Options exercised | 158 |
| | — |
| | — |
|
Purchase of Treasury Stock | (5,788 | ) | | — |
| | (5,788 | ) |
Restricted stock grants, including conversion of certain RSUs and PSUs, net of forfeitures | 171 |
| | — |
| | — |
|
Total shares outstanding, March 31, 2013 | 44,970 |
| | 13,937 |
| | (16,969 | ) |
Options exercised | 808 |
| | — |
| | — |
|
Purchase of Treasury Stock | (162 | ) | | — |
| | (162 | ) |
Restricted stock grants, including conversion of certain RSUs and PSUs, net of forfeitures | 237 |
| | — |
| | — |
|
Total shares outstanding, March 31, 2014 | 45,853 |
|
| 13,937 |
| | (17,131 | ) |
Options exercised | 415 |
| | — |
| | — |
|
Purchase of Treasury Stock | (336 | ) | | — |
| | (336 | ) |
Restricted stock grants, including conversion of certain RSUs and PSUs, net of forfeitures | 907 |
| | — |
| | — |
|
Total shares outstanding, March 31, 2015 | 46,839 |
| | 13,937 |
| | (17,467 | ) |
Note 9. Stock-based Compensation:
Employee Stock Incentive Plans
In September 2010, stockholders approved the amendment and restatement of the Westell Technologies, Inc. 2004 Stock Incentive Plan (the 2004 SIP Plan) that permits the issuance of restricted Class A Common Stock, non-qualified stock options, incentive stock options, stock appreciation rights, restricted stock units and performance stock units share awards to selected officers, employees, and non-employee directors of the Company. There are a total of 3,181,863 shares available for issuance under this plan as of March 31, 2015. Certain awards provide for accelerated vesting if there is a change in control (as defined in the 2004 SIP Plan) or when provided within individual employment contracts. The Company issues new shares of stock for awards under the 2004 SIP Plan.
Stock-Based Compensation Expense
Total stock-based compensation, excluding the impact of discontinued operations, is reflected in the Consolidated Statements of Operations as follows: |
| | | | | | | | | | | |
| Fiscal Year Ended March 31, |
(in thousands) | 2015 | | 2014 | | 2013 |
Cost of revenue | $ | 89 |
| | $ | 53 |
| | $ | 27 |
|
Sales and marketing | 170 |
| | 337 |
| | 190 |
|
Research and development | 452 |
| | 338 |
| | 115 |
|
General and administrative | 1,894 |
| | 1,143 |
| | 1,075 |
|
Stock-based compensation expense | 2,605 |
| | 1,871 |
| | 1,407 |
|
Income tax benefit | — |
| | — |
| | — |
|
Total stock-based compensation expense after taxes | $ | 2,605 |
| | $ | 1,871 |
| | $ | 1,407 |
|
Stock Options
Stock options that have been granted by the Company have an exercise price that is equal to the reported value of the Company’s stock on the grant date. Options usually vest annually from the date of grant over a period of 4 years. The Company’s options have a contractual term of 5, 7 or 10 years. Compensation expense is recognized on a straight-line basis over the vesting period for the award.
The Company uses the Black-Scholes model to estimate the fair value of employee stock options on the date of grant. That model employs parameters for which the Company has made estimates according to the assumptions noted below. Expected volatilities were based on historical volatilities of the Company’s stock. The expected option lives represent the period of time that options granted are expected to be outstanding based on historical trends. The risk-free interest rates were based on the United States Treasury yield curve for the expected term at the time of grant. The dividend yield was based on expected dividends at the time of grant, which has always been zero.
The Company recorded expense of $0.2 million in the twelve months ended March 31, 2015, 2014 and 2013 related to stock options. The Company received proceeds from the exercise of stock options of $0.3 million, $1.7 million, and $0.1 million in fiscal years 2015, 2014 and 2013, respectively. The total intrinsic value of options exercised during the years ended March 31, 2015, 2014 and 2013 was $0.4 million, $1.3 million, and $0.2 million, respectively.
Option activity for the twelve months ended March 31, 2015 is as follows:
|
| | | | | | | | | | | | |
| Shares | | Weighted- Average Exercise Price Per Share | | Weighted- Average Remaining Contractual Term (in years) | | Aggregate Intrinsic Value(1) (in thousands) |
Outstanding on March 31, 2014 | 1,835,445 |
| | $ | 2.02 |
| | | | |
Granted | 290,000 |
| | $ | 1.75 |
| | | | |
Exercised | (415,000 | ) | | $ | 0.62 |
| | | | |
Forfeited | (287,500 | ) | | $ | 2.45 |
| | | | |
Expired | (252,430 | ) | | $ | 2.68 |
| | | | |
Outstanding on March 31, 2015 | 1,170,515 |
| | $ | 2.20 |
| | 2.9 | | $ | 0 |
|
Vested or expected to vest as of March 31, 2015 | 1,121,371 |
| | $ | 2.22 |
| | 2.8 | | $ | 0 |
|
Exercisable on March 31, 2015 | 697,682 |
| | $ | 2.38 |
| | 1.4 | | $ | 0 |
|
(1) The intrinsic value for the stock options is calculated based on the difference between the exercise price of the underlying awards and the Westell Technologies’ close stock price as of the reporting date.
As of March 31, 2015, there was $0.3 million of pre-tax stock option compensation expense related to non-vested awards not yet recognized, including estimated forfeitures, which is expected to be recognized over a weighted-average period of 2.9 years.
The fair value of each option was estimated on the date of grant using the Black-Scholes option pricing model with the following weighted-average assumptions: |
| | | | | | | | | | | |
| Fiscal Year Ended March 31, |
| 2015 | | 2014 | | 2015 |
Input assumptions: | | | | | |
Expected volatility | 45 | % | | 42 | % | | 49 | % |
Risk-free interest rate | 1.2 | % | | 1.1 | % | | 0.7 | % |
Expected life | 4 years |
| | 5 years |
| | 5 years |
|
Expected dividend yield | — | % | | — | % | | — | % |
Output weighted-average grant-date fair value | $ | 0.63 |
| | $ | 0.91 |
| | $ | 0.89 |
|
Restricted Stock
Vesting of restricted stock is subject to continued employment with the Company. During fiscal years 2015, 2014 and 2013, non-employee directors received grants of 100,000, 90,000 and 70,000 shares, respectively, that each vests annually over 4 years. The Company recognizes compensation expense for employee issued restricted stock on a straight-line basis over the vesting periods for the award based on the market value of Westell Technologies stock on the date of grant adjusted for estimated forfeitures. On September 16, 2014, the Board of Directors modified the vesting provisions on all outstanding non-employee director restricted stock awards to include an accelerated vesting provision triggered upon a termination of service as a director following a failure to be nominated by the Board of Directors for re-election as a director. As a result of that modification, the requisite service period on all unvested restricted stock was shortened to the next expected nomination date in July 2015.
The following table sets forth restricted stock activity for the twelve months ended March 31, 2015: |
| | | | | | |
| Shares | | Weighted-Average Grant Date Fair Value |
Non-vested as of March 31, 2014 | 407,500 |
| | $ | 1.94 |
|
Granted | 100,000 |
| | $ | 3.53 |
|
Vested | (337,500 | ) | | $ | 1.89 |
|
Forfeited | — |
| | $ | — |
|
Non-vested as of March 31, 2015 | 170,000 |
| | $ | 2.98 |
|
The Company recorded $0.5 million, $0.5 million, and $0.6 million of expense in the twelve months ended March 31, 2015, 2014 and 2013, respectively, related to restricted stock. As of March 31, 2015, there was $0.1 million of pre-tax unrecognized compensation expense, including estimated forfeitures, related to non-vested restricted stock, which is expected to be recognized over a weighted-average period of 0.3 years. The total intrinsic fair value of shares vested during the years ended March 31, 2015, 2014, and 2013, was $1.2 million, $0.7 million, and $0.8 million, respectively.
Restricted Stock Units (RSUs)
In fiscal years 2015, 2014 and 2013, 780,500, 1,182,000 and 530,000 shares, respectively, of RSUs were awarded to certain key employees. These awards convert into shares of Class A Common Stock on a one-for-one basis upon vesting and vest in equal annual installments over 4 years from the grant dates. The Company recognizes compensation expense on a straight-line basis over the vesting for the award based on the market value of Westell Technologies stock on the date of grant adjusted for estimated forfeitures.
The Company recorded stock-based compensation expense of $1.7 million, $0.9 million and $0.6 million for RSUs in fiscal years 2015, 2014 and 2013, respectively. As of March 31, 2015, there was approximately $3.0 million of pre-tax unrecognized compensation expense, including estimated forfeitures, related to the RSUs, which is expected to be recognized over a weighted-average period of 2.8 years. The total intrinsic fair value of RSUs vested during the years ended March 31, 2015, 2014, and 2013, was $1.5 million, $0.5 million, and $0.3 million, respectively.
The following table sets forth the RSUs activity for the twelve months ended March 31, 2015:
|
| | | | | | |
| Shares | | Weighted-Average Grant Date Fair Value |
Non-vested as of March 31, 2014 | 1,679,000 |
| | $ | 3.09 |
|
Granted | 780,500 |
| | $ | 2.29 |
|
Vested | (677,500 | ) | | $ | 3.15 |
|
Forfeited | (372,250 | ) | | $ | 2.73 |
|
Non-vested as of March 31, 2015 | 1,409,750 |
| | $ | 2.72 |
|
Performance-based RSUs (PSUs)
The PSUs vest in annual increments based on the achievement of pre-established Company performance goals and continued employment. The number of PSUs earned, if any, can range from 0% to 200% of the target amount, depending on actual performance for four fiscal years following the grant date. Upon vesting, the PSUs convert into shares of Class A Common Stock on a one-for-one basis. The Company recognizes compensation expense on a straight-line basis for each annual performance measurement vesting period of the awards based on the market value of Westell Technologies stock on the date of grant adjusted for estimated forfeitures.
In fiscal year 2015, certain executives were granted a total of 217,500 PSUs at target. The performance targets in fiscal year 2015 for the fiscal year 2015 grants were not achieved and therefore no shares were earned in the first measurement period.
In fiscal year 2014, certain executives were granted a total of 285,000 PSUs at target. The performance in fiscal year 2014 measured against the first performance target resulted in the executives earning 94% of the PSUs. The targets in the second performance measurement period in fiscal year 2015 were not achieved and therefore no additional PSUs were earned in that period.
The Company recorded stock-based compensation expense of $0.1 million and $0.3 million for PSUs in fiscal years 2015 and 2014. There was no PSU expense in fiscal years 2013. As of March 31, 2015, there was approximately $0.1 million of pre-tax unrecognized compensation expense, including estimated forfeitures, related to the PSUs, which is expected to be recognized over a weighted-average period of 1.5 years. The total intrinsic fair value of PSUs vested during fiscal year 2015, was $0.3 million. There were no PSUs that vested in fiscal years 2014 or 2013.
The following table sets forth the PSUs activity for the twelve months ended March 31, 2015:
|
| | | | | | |
| Shares | | Weighted-Average Grant Date Fair Value |
Non-vested as of March 31, 2014 | 285,000 |
| | $ | 2.45 |
|
Granted | 217,500 |
| | $ | 3.83 |
|
Vested | (130,011 | ) | | $ | 2.44 |
|
Forfeited | (190,601 | ) | | $ | 3.36 |
|
Non-vested as of March 31, 2015 | 181,888 |
| | $ | 3.14 |
|
Note 10. Segment and Related Information:
Segment information is presented in accordance with a “management approach", which designates the internal reporting used by the chief operating decision-maker (CODM) for making decisions and assessing performance as the source of the Company's reportable segments. Westell’s Chief Executive Officer is the CODM. In fiscal 2015, the Company revised its segment reporting structure to realign internal reporting as a result of the full integration of Kentrox into Westell, and the CSI acquisition. The CODM continues to evaluate segment profit on gross profit less research and development expenses. In order to provide information that is comparable year to year, fiscal 2014 and 2013 segment information has been restated to reflect the new reporting structure. The accounting policies of the segments are the same as those for Westell Technologies, Inc. described in the summary of significant accounting policies.
The Company’s two reportable segments are as follows:
In-Building Wireless (IBW) Segment
The IBW segment solutions include distributed antenna systems (DAS) conditioners, high-performance digital repeaters and bi-directional amplifiers (BDAs), and system components and antennas, all used by wireless service providers and neutral-party
hosts to fine tune radio frequency (RF) signals that helps extend coverage to areas not served well or at all by traditional cell sites.
Communication Solutions Group (CSG) Segment
The CSG segment solutions include intelligent site management (ISM), cell site optimization (CSO), and outside plant (OSP) as follows:
• ISM solutions include a suite of Remote monitoring and control devices which, when combined with the Company's Optima management system, provides comprehensive machine-to-machine (M2M) communications that enable operators to remotely monitor, manage, and control site infrastructure and support systems.
• CSO solutions consist of tower mounted amplifiers (TMAs), small outdoor-hardened units mounted next to antennas on cell towers, enabling wireless service providers to improve the overall performance of a cell site, including increasing data throughput and reducing dropped connections.
• OSP solutions, which are sold to wireline and wireless service providers as well as industrial network operators, consist of a broad range of offerings, including cabinets, enclosures, and mountings; synchronous optical networks/time division multiplexing (SONET/TDM) network interface units; power distribution units; copper and fiber connectivity panels; hardened Ethernet switches; and systems integration services.
Segment information for the fiscal years ended March 31, 2015, 2014 and 2013, is set forth below:
|
| | | | | | | | | | | |
| Fiscal Year Ended March 31, 2015 (as restated (1)) |
(in thousands) | IBW | | CSG | | Total |
Revenue | $ | 37,714 |
| | $ | 46,413 |
| | $ | 84,127 |
|
Gross profit | 13,715 |
| | 13,095 |
| | 26,810 |
|
Gross margin | 36.4 | % | | 28.2 | % | | 31.9 | % |
Research & development | 8,955 |
| | 8,393 |
| | 17,348 |
|
Segment profit | $ | 4,760 |
| | $ | 4,702 |
| | 9,462 |
|
Operating expenses: | | | | | |
Sales & marketing | | | | | 12,407 |
|
General & administrative | | | | | 14,678 |
|
Intangible amortization | | | | | 6,377 |
|
Restructuring | | | | | 3,243 |
|
Goodwill impairment | | | | | 31,997 |
|
Operating income (loss) | | | | | (59,240 | ) |
Other income (expense), net | | | | | (2 | ) |
Income tax (expense) benefit | | | | | 201 |
|
Net income (loss) from continuing operations | | | | | $ | (59,041 | ) |
(1) See Note 1 for restatement information. | | | | | |
| Fiscal Year Ended March 31, 2014 (as restated (1)) |
(in thousands) | IBW | | CSG | | Total |
Revenue | $ | 13,096 |
| | $ | 88,977 |
| | $ | 102,073 |
|
Gross profit | 4,161 |
| | 36,300 |
| | 40,461 |
|
Gross margin | 31.8 | % |
| 40.8 | % | | 39.6 | % |
Research & development | 1,360 |
| | 9,979 |
| | 11,339 |
|
Segment profit | $ | 2,801 |
| | $ | 26,321 |
| | 29,122 |
|
Operating expenses: | | | | |
|
|
Sales & marketing | | | | | 13,304 |
|
General & administrative | | | | | 14,027 |
|
Intangible amortization | | | | | 4,889 |
|
Restructuring | | | | | 335 |
|
Operating income (loss) | | | | | (3,433 | ) |
Other income (expense), net | | | | | (56 | ) |
Income tax (expense) benefit | | | | | 7,910 |
|
Net income (loss) from continuing operations | | | | | $ | 4,421 |
|
(1) See Note 1 for restatement information.
|
| | | | | | | | | | | |
| Fiscal Year Ended March 31, 2013 |
(in thousands) | IBW | | CSG | | Total |
Revenue | $ | 904 |
| | $ | 37,904 |
| | $ | 38,808 |
|
Gross profit | 391 |
| | 12,225 |
| | 12,616 |
|
Gross margin | 43.3 | % | | 32.3 | % | | 32.5 | % |
Research & development | 305 |
| | 5,623 |
| | 5,928 |
|
Segment profit | $ | 86 |
| | $ | 6,602 |
| | 6,688 |
|
Operating expenses: | | | | | |
Sales & marketing | | | | | 6,783 |
|
General & administrative | | | | | 9,310 |
|
Intangible amortization | | | | | 887 |
|
Restructuring | | | | | 149 |
|
Goodwill impairment | | | | | 2,884 |
|
Operating income (loss) | | | | | (13,325 | ) |
Other income (expense), net | | | | | 175 |
|
Income tax (expense) benefit | | | | | (29,392 | ) |
Net income (loss) from continuing operations | | | | | $ | (42,542 | ) |
Segment asset information is not reported to or used by the CODM.
Enterprise-wide and Geographic Information
More than 90% of the Company’s revenues were generated in the United States in fiscal years 2015, 2014 and 2013. More than 90% of the Company's long-lived assets are located in the United States.
Significant Customers and Concentration of Credit
The Company is dependent on certain major companies operating in telecommunications markets that represent more than 10% of the total revenue. Sales to major customers and successor companies that exceed 10% of total revenue are as follows:
|
| | | | | | | | |
| Fiscal Year Ended March 31, |
| 2015 | | 2014 | | 2013 |
Verizon | 30.5 | % | | 23.9 | % | | 17.1 | % |
Telamon | 5.8 | % | | 30.3 | % | | 12.4 | % |
Time Warner Cable | 2.6 | % | | 2.3 | % | | 10.4 | % |
Major companies operating in telecommunications markets comprise a significant portion of the Company’s trade receivables. Receivables from major customers that exceed 10% of total accounts receivable balance are as follows:
|
| | | | | |
| Fiscal Year Ended March 31, |
| 2015 | | 2014 |
Verizon | 30.4 | % | | 30.6 | % |
AT&T | 12.7 | % | | 16.7 | % |
Note 11. Restructuring:
In the fourth quarter of fiscal year 2015, the Company approved a plan to restructure its business, including reduction of headcount and consolidation of office space within the Aurora headquarters facility, with the intent to optimize operations. The restructuring was completed during the fourth quarter of fiscal year 2015 and impacted 17 employees. The Company recognized a restructuring expense of $3.2 million in the three months ended March 31, 2015, including a non-cash charge of $2.7 million in other associated costs related to a loss on a lease. The loss on the lease includes lease liabilities offset by estimated sublease income. As of March 31, 2015, $1.2 million and $1.6 million of the reorganization costs primarily related to the office space are unpaid and accrued on the Consolidated Balance Sheets presented in accrued reorganization and accrued
reorganization non-current, respectively. The reorganization costs are expected to be paid by fiscal year 2018 concurrent with the termination date of the contractual lease.
In fiscal year 2014, the Company acquired Kentrox and identified 12 redundant employees who exited the business after a period of time. The Company recognized restructuring expense of $55,000 and $335,000 in fiscal years 2015 and 2014, respectively, for severance for these transitional employees. The total cost of this action was $390,000. The restructuring was completed during the first quarter of fiscal year 2015. As of March 31, 2014, $278,000 of these costs has been paid leaving an unpaid balance of $57,000, which is presented on the Consolidated Balance Sheets within accrued reorganization. As of March 31, 2015 all of these costs have been paid.
The Company's recognized restructuring expense of $149,000 in fiscal year 2013 for personnel costs related to severance and other relocation costs for the Noran Tel relocation. The relocation resulted in the termination of 35 employees located in Canada. The total cost of this action was $424,000. The relocation was completed during the quarter ended September 30, 2012. As of March 31, 2014, all of these costs have been paid.
Total fiscal year 2015 restructuring charges and their utilization are summarized as follows: |
| | | | | | | | | | | |
(in thousands) | Employee -related | | Other costs | | Total |
Liability at March 31, 2014 | $ | 57 |
| | $ | — |
| | $ | 57 |
|
Charged | 337 |
| | 2,906 |
| | 3,243 |
|
Accelerated depreciation of leasehold improvements | — |
| | (72 | ) | | (72 | ) |
Payments | (379 | ) | | (46 | ) | | (425 | ) |
Liability at March 31, 2015 | $ | 15 |
| | $ | 2,788 |
| | $ | 2,803 |
|
Total fiscal year 2014 restructuring charges and their utilization are summarized as follows:
|
| | | | | | | | | | | |
(in thousands) | Employee -related | | Other costs | | Total |
Liability at March 31, 2013 | $ | 6 |
| | $ | — |
| | $ | 6 |
|
Charged | 335 |
| | — |
| | 335 |
|
Payments | (284 | ) | | — |
| | (284 | ) |
Liability at March 31, 2014 | $ | 57 |
| | $ | — |
| | $ | 57 |
|
Total fiscal year 2013 restructuring charges and their utilization are summarized as follows:
|
| | | | | | | | | | | |
(in thousands) | Employee
-related | | Other
costs | | Total |
Liability at March 31, 2012 | $ | 561 |
| | $ | 52 |
| | $ | 613 |
|
Charged | 89 |
| | 60 |
| | 149 |
|
Payments | (644 | ) | | (112 | ) | | (756 | ) |
Liability at March 31, 2013 | $ | 6 |
| | $ | — |
| | 6 |
|
Note 12. Short-term Investments:
The following table presents short-term investments as of March 31, 2015, and 2014:
|
| | | | | | | |
(in thousands) | March 31, 2015 | | March 31, 2014 |
Certificates of deposit | $ | 7,912 |
| | $ | 1,476 |
|
Held-to-maturity, pre-refunded municipal bonds | 15,994 |
| | 14,108 |
|
Total investments | $ | 23,906 |
| | $ | 15,584 |
|
The fair value of short-term investments approximates their carrying amounts due to the short-term nature of these financial assets and therefore there are no unrecognized gains or losses. The Company does not intend to sell the investments and it is not more likely than not that the Company will be required to sell the investments before recovery of their amortized cost bases.
Note 13. Fair Value Measurements:
Fair value is defined by ASC 820 as the price that would be received upon selling an asset or paid to transfer a liability in an orderly transaction between market participants at the measurement date. ASC 820 establishes a three-level fair value hierarchy that prioritizes the inputs used to measure fair value. The hierarchy requires entities to maximize the use of observable inputs and minimize the use of unobservable inputs. The three levels of inputs used to measure fair value are as follows:
Level 1 – Quoted prices in active markets for identical assets and liabilities.
| |
• | Level 2 – Quoted prices in active markets for similar assets and liabilities, or other inputs that are observable for the asset or liability, either directly or indirectly, for substantially the full term of the financial instrument. |
| |
• | Level 3 – Unobservable inputs that are supported by little or no market activity and that are significant to the fair value of the assets and liabilities. This includes certain pricing models, discounted cash flow methodologies and similar techniques that use significant unobservable inputs. |
The Company’s money market funds are measured using Level 1 inputs. The ANTONE contingent consideration described in Note 2 is measured using Level 3 inputs.
The following table presents financial assets, excluding cash, and non-financial liabilities measured at fair value on a recurring basis and their related valuation inputs as of March 31, 2015:
|
| | | | | | | | | | | | | | | | |
(in thousands) | Total Fair Value of Asset or Liability | | Quoted Prices in Active Markets for Identical Assets (Level 1) | | Significant Other Observable Inputs (Level 2) | | Significant Unobservable Inputs (Level 3) | | Balance Sheet Classification |
Assets: | | | | | | | | | |
Money market funds | $ | 2,879 |
| | $ | 2,879 |
| | — |
| | — |
| | Cash and cash equivalents |
Liabilities: | | | | | | | | | |
Contingent consideration, current | $ | 1,184 |
| | — |
| | — |
| | $ | 1,184 |
| | Contingent consideration |
Contingent consideration, long-term | $ | 400 |
| | — |
| | — |
| | $ | 400 |
| | Contingent consideration non-current |
The following table presents financial assets, excluding cash, and non-financial liabilities measured at fair value on a recurring basis and their related valuation inputs as of March 31, 2014:
|
| | | | | | | | | | | | | | | | |
(in thousands) | Total Fair Value of Asset or Liability | | Quoted Prices in Active Markets for Identical Assets (Level 1) | | Significant Other Observable Inputs (Level 2) | | Significant Unobservable Inputs (Level 3) | | Balance Sheet Classification |
Assets: | | | | | | | | | |
Money market funds | $ | 117 |
| | $ | 117 |
| | — |
| | — |
| | Cash and cash equivalents |
Liabilities: | | | | | | | | | |
Contingent consideration, current | 2,067 |
| | — |
| | — |
| | 2,067 |
| | Contingent consideration |
Contingent consideration, long-term | $ | 574 |
| | — |
| | — |
| | $ | 574 |
| | Contingent consideration non-current |
The fair value of the money market funds approximates their carrying amounts due to the short-term nature of these financial assets.
In connection with the ANTONE acquisition in the quarter ended June 30, 2012, payment of a portion of the purchase price is contingent upon the profitability of the acquired products for post-closing periods through June 30, 2016, and may be offset by working capital adjustments and certain indemnification claims. The Company estimates the fair value of contingent consideration as the present value of the expected payments over the term of the arrangement based on financial forecasts of future profitability of the acquired products and reaching the forecast. This estimate is subject to ongoing evaluation. The actual cash payment may range from $1.3 million to $2.7 million.
The fair value measurement of contingent consideration as of March 31, 2015 and March 31, 2014, encompasses the following significant unobservable inputs: |
| | | | | | | |
| Unobservable Inputs for Fiscal Year Ended March 31, |
($ in thousands) | 2015 | | 2014 |
Estimated earn-out contingent consideration | $ | 3,500 |
| | $ | 3,500 |
|
Working capital and other adjustment | $ | (444 | ) | | $ | (444 | ) |
Indemnification related to warranty claims | $ | (303 | ) | | $ | (303 | ) |
Discount rate | 6.3 | % | | 7.5 | % |
Approximate timing of cash flows | 1.4 years |
| | 1.4 years |
|
The following table summarizes contingent consideration activity: |
| | | | | | | |
| Fiscal Year Ended March 31, |
($ in thousands) | 2015 | | 2014 |
Balance beginning of period | $ | 2,641 |
| | $ | 2,333 |
|
Contingent consideration – payments | (1,104 | ) | | — |
|
Contingent consideration – change in fair value (included in G&A expense) | 47 |
| | 308 |
|
Balance end of period | $ | 1,584 |
| | $ | 2,641 |
|
Note 14. Variable Interest Entity and Guarantee:
The Company has a 50% equity ownership in AccessTel Kentrox Australia PTY LTD (AKA). AKA distributes network management solutions provided by the Company and the other 50% owner to one customer. The Company holds equal voting control with the other owner. All actions of AKA are decided at the board level by majority vote. The Company evaluated ASC topic 810, Consolidations, and concluded that AKA is a variable interest entity (VIE). The Company has concluded that it is not the primary beneficiary of AKA and therefore consolidation is not required. As of March 31, 2015 and March 31, 2014, the carrying amount of the Company's investment in AKA was approximately $0.1 million, which is presented on the Consolidated Balance Sheets within other assets.
The Company's revenue to AKA for fiscal year 2015 and 2014 was $1.7 million and $4.5 million, respectively. Accounts receivable from AKA is $0.4 million and $0.4 million and deferred revenue relating to maintenance contracts is $1.1 million and $1.0 million as of March 31, 2015 and March 31, 2014, respectively. The Company also has an unlimited guarantee for the performance of the other 50% owner in AKA, who primarily provides support and engineering services to the customer. This guarantee was put in place at the request of the AKA customer. The guarantee which is estimated to have a maximum potential future payment of $0.7 million, will stay in place as long as the contract between AKA and the customer is in place. The Company would have recourse against the other 50% owner in AKA in the event the guarantee is triggered. The Company determined that it could perform on the obligation it guaranteed at a positive rate of return and therefore did not assign value to the guarantee. The Company's exposure to loss as a result of its involvement with AKA, exclusive of lost profits, is limited to the items noted above.
Note 15. Benefit Plans:
Westell 401(k) Plan
The Company sponsors a 401(k) benefit plan (the Westell Plan), which covers substantially all of its domestic employees. The Westell Plan is a salary reduction plan that allows employees to defer up to 100% of wages subject to Internal Revenue Service limits. The Westell Plan also allows for Company discretionary and matching contributions. In January 2014, the Company established the matching contribution percentage made by the Company of 50% of participants' contributions, up to 4%. Matching contribution expense in fiscal years 2015 and 2014 was approximately $0.3 million and $0.1 million, respectively. There were no matching contributions in fiscal year 2013.
Kentrox 401(k) Plan
During the first nine months of fiscal year 2014, the Company sponsored a 401(k) benefit plan (the Kentrox Plan), which covered substantially all of its domestic employees. On January 1, 2014, Kentrox was merged with and into Westell, Inc. The Kentrox Plan was a salary reduction plan that allowed employees to defer up to 75% of wages subject to Internal Revenue Service limits. The Kentrox Plan also allowed for Company discretionary and matching contributions. The Company matching contribution percentage made by the Company was 50% of participants' contributions, up to 6%. Matching contribution expense in the first nine months of fiscal year 2014 was approximately $0.1 million.
CSI 401(k) Plan
CSI employees participated in a 401(k) plan through ADPTotalSource (the CSI Plan). The CSI Plan allowed employees to defer up to 100% of wages subject to Internal Revenue Service limits. On January 1, 2015, CSI was merged with and into Westell, Inc. The Company contributed a flat 3% of eligible employee earnings, regardless of the individual employee's contribution level. Contribution expense was approximately $0.2 million for the first nine months of fiscal year 2015 and $16,000 for the one month since CSI was acquired on March 1, 2014 in fiscal year 2014.
Note 16. Related Party Transactions:
The Company purchased $0.3 million of raw material components from XMA Corporation (XMA) in fiscal year 2015. Scott Goodrich, the Company's President of In-Building Wireless owns 13% of the common stock of XMA.
Note 17. Quarterly Results of Operations (Unaudited):
The following tables present certain financial information for each of the last eight fiscal quarters. The Company believes that the unaudited information regarding each of these quarters is prepared on the same basis as the audited Consolidated Financial Statements of the Company appearing elsewhere in this Form 10-K/A. In the opinion of management, all necessary adjustments (consisting only of normal recurring adjustments) have been included to present fairly the unaudited quarterly results when read in conjunction with the audited Consolidated Financial Statements of the Company and the Notes thereto appearing elsewhere in this Form 10-K/A. These quarterly results of operations are not necessarily indicative of the results for any future period. Previously reported quarterly amounts have been adjusted for the effects of the discontinued operations described in Note 1.
The fiscal third quarter ending December 31 contains seasonality effects in the CSG segment. The CSG segment sells equipment that is installed outdoors and the ordering of such equipment declines during and in advance of the colder months. Customer budget cycles for may also contribute to revenue variability in those same periods. Revenue mix and gross profit by product varies by quarter. Charges for excess and obsolete inventory vary by quarter and may cause variability in gross margins.
|
| | | | | | | | | | | | | | | |
| Fiscal Year 2015 Quarter Ended |
| June 30, 2014 | | Sept. 30, 2014 (as restated (1)) | | Dec. 31, 2014 | | Mar. 31, 2015 |
(in thousands, except per share amounts) | | | | | | | |
Revenue | $ | 27,825 |
| | $ | 23,646 |
| | $ | 14,043 |
| | $ | 18,613 |
|
Gross profit | 9,684 |
| | 8,065 |
| | 4,395 |
| | 4,666 |
|
Goodwill impairment | — |
| | 11,450 |
| | 20,547 |
| | — |
|
Restructuring | 57 |
| | (2 | ) | | — |
| | 3,188 |
|
Total operating expenses | 12,592 |
| | 23,662 |
| | 31,978 |
| | 17,818 |
|
Loss before income taxes and discontinued operations | (2,847 | ) | | (15,613 | ) | | (27,612 | ) | | (13,170 | ) |
Income tax (expense) benefit | 29 |
| | 69 |
| | 72 |
| | 31 |
|
Net income (loss) from continuing operations | (2,818 | ) | | (15,544 | ) | | (27,540 | ) | | (13,139 | ) |
Income (loss) from discontinued operations, net of tax | — |
| | — |
| | — |
| | 139 |
|
Net income (loss) | (2,818 | ) | | (15,544 | ) | | (27,540 | ) | | (13,000 | ) |
Net income (loss) per common share: | | | | | | | |
Basic | $ | (0.05 | ) | | $ | (0.26 | ) | | $ | (0.46 | ) | | $ | (0.22 | ) |
Diluted | $ | (0.05 | ) | | $ | (0.26 | ) | | $ | (0.46 | ) | | $ | (0.22 | ) |
(1) See Note 1 for restatement information.
Revenue and gross profit were negatively impacted in the December quarter from significant reductions in capital spending by the Company's largest customers, North American wireless providers. Operating expenses in fiscal year 2015 included the following items: the September and December quarter included $11.5 million and $20.5 million of expense for goodwill impairment charge, respectively; the March quarter included a $3.2 million in restructuring and $2.1 million of expense related to the departure of the former CEO.
|
| | | | | | | | | | | | | | | |
| Fiscal Year 2014 Quarter Ended |
| June 30, 2013 | | Sept. 30, 2013 | | Dec. 31, 2013 | | Mar. 31, 2014 (as restated (1)) |
(in thousands, except per share amounts) | | | | | | | |
Revenue | $ | 22,456 |
| | $ | 29,960 |
| | $ | 25,236 |
| | $ | 24,421 |
|
Gross profit | 8,417 |
| | 12,022 |
| | 11,932 |
| | 8,090 |
|
Restructuring | 66 |
| | 169 |
| | 38 |
| | 62 |
|
Total operating expenses | 11,018 |
| | 10,728 |
| | 9,909 |
| | 12,239 |
|
Loss before income taxes and discontinued operations | (2,731 | ) | | 1,392 |
| | 1,992 |
| | (4,142 | ) |
Income tax (expense) benefit | (19 | ) | | (68 | ) | | (38 | ) | | 8,035 |
|
Net income (loss) from continuing operations | (2,750 | ) | | 1,324 |
| | 1,954 |
| | 3,893 |
|
Income (loss) from discontinued operations, net of tax | (14 | ) | | 4 |
| | (29 | ) | | (6 | ) |
Net income (loss) | (2,764 | ) | | 1,328 |
| | 1,925 |
| | 3,887 |
|
Net income (loss) per common share: | | | | | | | |
Basic | $ | (0.05 | ) | | $ | 0.02 |
| | $ | 0.03 |
| | $ | 0.07 |
|
Diluted | $ | (0.05 | ) | | $ | 0.02 |
| | $ | 0.03 |
| | $ | 0.07 |
|
(1) See Note 1 for restatement information.
The Company acquired CSI on March 1, 2014 which accounted for $3.7 million of revenue in the March quarter. The Company's revenue and gross profit were impacted by a specific customer project that completed in the December quarter. In the fourth quarter of fiscal 2014, deferred tax liabilities of $8.3 million resulted from the acquisitions relating primarily to acquired intangible assets. The Company's anticipated ability to realize deferred tax assets from the reversal of these deferred tax liabilities resulted in a reversal of valuation allowance which was recorded in the fourth quarter of fiscal year 2014.
WESTELL TECHNOLOGIES, INC. AND SUBSIDIARIES
SCHEDULE II — VALUATION AND QUALIFYING ACCOUNTS
|
| | | | | | | | | | | | | | | |
(In thousands) | Balance at Beginning of Year (as restated(1)) | | Net Additions Charged to Cost and Expenses | | Additions (Deductions) (as restated (1)) | | Balance at End of Year (as restated (1)) |
2015 | | | | | | | |
Accounts receivable allowances | $ | 40 |
| | $ | 85 |
| | $ | (72 | ) | (2) | $ | 53 |
|
Reserve for excess and obsolete inventory and net realizable value | 4,266 |
| | 5,674 |
| | (893 | ) | (3) | 9,047 |
|
Deferred tax assets valuation allowance | 29,414 |
| | — |
| | 10,253 |
| (4) | 39,667 |
|
Reserve for returns (5) | 42 |
| | 973 |
| | (660 | ) | | 355 |
|
2014 | | | | | | | |
Accounts receivable allowances | $ | 10 |
| | $ | 30 |
| | $ | — |
| | $ | 40 |
|
Reserve for excess and obsolete inventory and net realizable value | 2,032 |
| | 2,881 |
| | (647 | ) | (3) | 4,266 |
|
Deferred tax assets valuation allowance | 36,285 |
| | — |
| | (6,871 | ) | (4) | 29,414 |
|
Reserve for returns (5) | 19 |
| | 189 |
| | (166 | ) | | 42 |
|
2013 | | | | | | | |
Accounts receivable allowances | $ | 12 |
| | $ | — |
| | $ | (2 | ) | | $ | 10 |
|
Reserve for excess and obsolete inventory and net realizable value | 1,479 |
| | 1,090 |
| | (537 | ) | (3) | 2,032 |
|
Deferred tax assets valuation allowance | 2,253 |
| | — |
| | 34,032 |
| (4) | 36,285 |
|
Reserve for returns (5) | 13 |
| | 218 |
| | (212 | ) | | 19 |
|
(1)See Note 1 for restatement information.
(2)Accounts written off, net of recoveries.
(3)Inventory charged against inventory reserves.
(4)Change in valuation allowance due to assessment of realizability of deferred tax assets.
(5)Included in allowance for account receivable.