UNITED STATES
SECURITIES AND EXCHANGE COMMISSION
Washington, D.C. 20549
FORM 10-K
| x | Annual Report pursuant to Section 13 or 15(d) of the Securities Exchange Act of 1934 |
For the fiscal year ended March 31, 2010
or
| ¨ | Transition Report pursuant to Section 13 or 15(d) of the Securities Exchange Act of 1934 |
For the transition period from to .
Commission file number: 0-27266
WESTELL TECHNOLOGIES, INC.
(Exact name of registrant as specified in its charter)
| Delaware | 36-3154957 | |
| (State or other jurisdiction of incorporation or organization) |
(I.R.S. Employer Identification No.) |
750 North Commons Drive, Aurora, Illinois 60504
(Address of principal executive offices) (Zip Code)
Registrant’s telephone number, including area code: (630) 898-2500
| Securities registered pursuant to Section 12(b) of the Act: |
Name of each exchange on which registered: | |
| Class A Common Stock, $.01 par value | NASDAQ Global Select Market |
Securities registered pursuant to Section 12(g) of the Act: None
Indicate by check mark if the registrant is a well-known seasoned issuer, as defined in Rule 405 of the Act. Yes ¨ No x
Indicate by check mark if the registrant is not required to file reports pursuant to Section 13 of Section 15(d) of the Act. Yes ¨ No x
Indicate by check mark whether the registrant (1) has filed all reports required to be filed by Section 13 or 15(d) of the Securities Exchange Act of 1934 during the preceding 12 months (or for such shorter period that the registrant was required to file such reports), and (2) has been subject to such filing requirements for the past 90 days. Yes x No ¨
Indicate by check mark whether the registrant has submitted electronically and posted on its corporate Web site, if any, every Interactive Data File required to be submitted and posted pursuant to Rule 405 of Regulation S-T (§ 229.405 of this chapter) during the preceding 12 months (or for such shorter period that the registrant was required to submit and post such files). Yes ¨ No ¨
Indicate by check mark if disclosure of delinquent filers pursuant to Item 405 of Regulation S-K (§229.405 of this chapter) is not contained herein, and will not be contained, to the best of registrant’s knowledge, in definitive proxy or information statements incorporated by reference in Part III of this Form 10-K or any amendment to this Form 10-K. x
Indicate by check mark whether the registrant is a large accelerated filer, an accelerated filer, a non-accelerated filer, or a smaller reporting company. See the definitions of “large accelerated filer,” “accelerated filer” and “smaller reporting company” in Rule 12b-2 of the Exchange Act. (Check One):
| Large Accelerated Filer | ¨, | Accelerated Filer | ¨, | |||
| Non-Accelerated Filer | ¨ (Do not check if a smaller reporting company), | Smaller Reporting Company | x | |||
Indicate by check mark whether the registrant is a shell company (as defined in Rule 12b-2 of the Exchange Act). Yes ¨ No x
The estimated aggregate market value of voting and non-voting Class A Common Stock held by non-affiliates (within the meaning of the term under the applicable regulations of the Securities and Exchange Commission) as of September 30, 2009 (based upon an estimate that 74% of the shares are so owned by non-affiliates and upon the average of the high and low prices for the Class A Common Stock on the NASDAQ Global Select Market on that date) was approximately $57 million. Determination of stock ownership by non-affiliates was made solely for the purpose of responding to this requirement and registrant is not bound by this determination for any other purpose.
As of May 13, 2010, 52,832,326 shares of the registrant’s Class A Common Stock were outstanding and 14,693,619 shares of registrant’s Class B Common Stock (which automatically converts on a one-for-one basis into shares of Class A Common Stock upon a transfer of such stock except transfers to certain permitted transferees) were outstanding.
DOCUMENTS INCORPORATED BY REFERENCE
Portions of the registrant’s definitive proxy statement for the 2010 Annual Stockholders’ Meeting are incorporated by reference into Part III hereof.
2010 ANNUAL REPORT ON FORM 10-K CONTENTS
CAUTIONARY STATEMENT REGARDING FORWARD-LOOKING INFORMATION
Certain statements contained herein that are not historical facts or that contain the words “believe”, “expect”, “intend”, “anticipate”, “estimate”, “may”, “will”, “plan”, “should”, or derivatives thereof and other words of similar meaning are forward-looking statements that involve risks and uncertainties. Actual results may differ materially from those expressed in or implied by such forward-looking statements. Factors that could cause actual results to differ materially include, but are not limited to, product demand and market acceptance risks, need for financing, economic weakness in the United States (“U.S.”) economy and telecommunications market, the impact of competitive products or technologies, competitive pricing pressures, product cost increases, new product development, excess and obsolete inventory, commercialization and technological delays or difficulties (including delays or difficulties in developing, producing, testing and selling new products and technologies), the effect of Westell’s accounting policies, the need for additional capital, the effect of economic conditions and trade, legal social and economic risks (such as import, licensing and trade restrictions), retention of key personnel and other risks more fully described in this Form 10-K for the fiscal year ended March 31, 2010, under Item 1A - Risk Factors. The Company undertakes no obligation to publicly update these forward-looking statements to reflect current events or circumstances after the date hereof or to reflect the occurrence of unanticipated events or otherwise.
Trademarks
The following terms used in this filing are our trademarks: WESTELL BOXER®, CellPak® , CPI Conference Plus, Inc. and Design®, ConferencePlus®, LiteLine®, HomeCloud™, OS Plant Systems®, ProLine®, WESTELL SHADE®, UltraLine®, VersaLink®, VirtualEdge and Design® and Westell®. All other trademarks appearing in this filing are the property of their holders.
PART I
| ITEM 1. | BUSINESS |
Westell Technologies, Inc., (the “Company”) was incorporated in Delaware in 1980 and is headquartered at 750 North Commons Drive, Aurora, Illinois. The Company is comprised of three operating segments: Customer Networking Solutions (“CNS”) equipment, Outside Plant Systems (“OSPlant Systems” or “OSP”) equipment, both segments, collectively, referred to as “combined equipment segments” or “equipment segments” and ConferencePlus services segment. Segment financial information for fiscal years 2010, 2009 and 2008 is set forth in the footnotes to the March 31, 2010 consolidated financial statements.
CNS Segment
In the CNS segment, the Company designs, distributes, markets and services a broad range of carrier-class broadband products. The CNS family of broadband products enables high-speed transport and networking of voice, data, video, and other advanced services. The products allow service providers to deliver services, content, and applications over existing copper, fiber, coax, and wireless infrastructures. Westell CNS products are typically installed in consumer residences or small businesses as a key component of a broadband service package.
CNS Products. The Company’s CNS products enable residential customers, small businesses, and small office/home office (“SOHO”) users to access and share broadband services on networked computers, telephones, cell phones, televisions, media players, and other networked devices. A broad offering of networking products and technologies allows the Company to address several segments of the service provider market, distinguished by the methods used to deliver their services: wireline operators (copper and fiber), mobile network operators (“wireless”), cable multi-service operators (hybrid fiber-coax), and integrated carriers that operate as combinations of the other three operators.
- 1 -
The following table sets forth a list of the Company’s principal CNS products and their applications:
| Product |
Description |
Applications | ||
| LiteLine ADSL2+ Modem | Customer premises equipment that is connected to a telephone line that has been configured to provide Asymmetrical Digital Subscriber Line (ADSL and ADSL2+) service from the telephone company. The LiteLine is a plug-and-play device that connects to the end customer through a single Ethernet or USB port. | Enables residential and SOHO customers of ADSL service to connect one or more PC’s and other computer networking equipment to the ADSL service for high speed Internet access with routing and security protection all in one box. | ||
| ProLine ADSL2+ manageable Modem/NAT Router | Similar in all ways to the LiteLine, the ProLine provides the added benefit of allowing remote diagnostics, maintenance, software upgrades and other remotely managed services. | In addition to providing the same applications as the LiteLine, the ProLine offers service providers the ability to provide customers a higher level of service and performance. | ||
| VersaLink Gateway | A compact, versatile gateway device that combines an ADSL2+ modem along with wired Ethernet and WiFi networking features. Versions are also available without the ADSL2+ modem, for wireless and other service providers. | Enables residential, SOHO, and small businesses to network their broadband service to multiple PCs and other networked devices with wired and wireless access. | ||
| UltraLine Series3 Wireless Broadband Home Router |
Ultra high-speed gateways that deliver secure, high-quality, data, voice, IP video services, and advanced services and applications over a variety of network access methods and home networking technologies, including fiber optic, copper, coax, WiFi and Ethernet. | UltraLine supports a wide variety of wired and wireless broadband applications, particularly high-speed IP data video services delivered over fiber optic networks. | ||
OSP Segment
In the OSP segment, the Company designs, distributes, markets and services a broad range of carrier-class digital transmission, remote monitoring, power distribution and demarcation products. The Company’s OSP products offer next-generation outdoor cabinets, enclosures, power distribution panels, flexible edge connectors (fiber, Ethernet and coax), remote monitoring solutions, DS1 and DS3 transmission plugs. These solutions are optimized for wireless backhaul, service delivery to business enterprise and smart grid applications. The OSP team also provides a value-added Customized Systems Integration (“CSI”) service, offering its customers a single source for complete turnkey solutions, reducing the time-to-market and expenses incurred through third-party contractors and eliminating the need to design, assemble and test on the job site. Our target customers include wireline service providers, wireless service providers, multiple systems operators (“MSOs”), integrated carrier, utility providers and original equipment manufacturers (“OEMs”) worldwide (all known as “service providers”). The power distribution and remote monitoring products are designed and provided through the Company’s Noran Tel subsidiary located in Regina, Saskatchewan, Canada, which was acquired on January 2, 2007.
OSP Products. The Company’s OSP products provide service providers with products to transport, maintain and improve the reliability of services delivered over copper and fiber lines in the local access network.
- 2 -
The following table sets forth a list of the Company’s principal OSP products and their applications:
| Product |
Description |
Applications | ||
| T1 NIU-PM (Network Interface Unit with Performance Monitoring) | T1 Network Interface Unit with Performance Monitoring that stores circuit performance and maintenance information for a single T1 circuit. | Provides a point of demarcation between the telephone company equipment and customer’s equipment on T1 circuits. The T1 NIU-PM units provide enhanced maintenance and remote performance monitoring of T1 circuits. This functionality provides troubleshooting capability that helps the telephone company reduce maintenance costs and customer down-time, thereby improving their customer satisfaction. | ||
| NIU Mountings | NIU Mountings are electronic enclosures with connectorized backplanes that house T1 NIU-PM units, and HDSL Remote Terminal cards, including those from other manufacturers such as Adtran. | Deployed by a telephone company at their customer’s premises locations to terminate their T1 circuits. | ||
| DS3 NIU-PM (Network Interface Unit with Performance Monitoring) | DS3 Network Interface Units with Performance Monitoring including a family of mountings. | Facilitates the maintenance, monitoring, extension, and demarcation of DS3 facilities. Can be deployed in central offices for a DS3 hand-off to alternate carriers, and also customer premises locations. | ||
| VirtualEdge | A flexible portfolio of standard 19” or 23” relay rack mount panels and wall mount enclosures designed with a “mix and match” architecture for Ethernet, fiber or coax cable. These products facilitate easy and simple splicing of optical fiber cables, and/or termination of copper-based Ethernet, and coax handoffs. | Provides a physical demarcation for Ethernet, DS1, DS3, optical fiber and coax based services at the customer premises. | ||
| WESTELL SHADE | A GR-487 Issue 2 compliant universal environmental equipment cabinet supporting up to 225W of internal heat dissipation using the Company’s dynamic cooling system that requires no filters thereby reducing maintenance cost. Equipment housing is completely sealed preventing contaminates from entering the equipment chamber. | Ideal for broadband and cellular backhaul applications for harsh environments. An actively cooled outdoor equipment cabinet designed to reduce the effects of solar loading and internal equipment heat generation to help ensure maintenance free equipment operation in conditions ranging from -40°C to +65°C. | ||
| CellPak | Outdoor passively cooled equipment enclosures. | Provides a sealed “passively” cooled equipment enclosure ideally suited for cellular farm backhaul demarcation hand-offs from a wireline carrier (telco or MSO) to wireless carriers. | ||
- 3 -
(Continued from prior page)
| Product |
Description |
Applications | ||
| Power Distribution Products | Fuse panels and battery distribution. Secondary DC power distribution products ranging from fuse and breaker panels to alarm panels. | Standard 19” or 23” rack mounting for service providers central offices, remote terminals and enclosures to provide secondary DC power distribution to operate equipment. Safely protects operating equipment in the event of fault current. | ||
| SiteVu Family of Remote Monitoring Systems | A powerful compact and flexible monitoring family of products that provides visibility to remote site environmentals, batteries, and equipment status issues. BattVu is optimized to monitor batteries and temperature remotely with SiteVu from a user’s desk top or network operations center. | Applications include service provider’s central offices, remote terminals, and enclosures to provide environmental information such as temperature, air flow, humidity and smoke, battery condition, and equipment operating status. | ||
| Customized Systems Integration service | A one-stop shop for complete turnkey solutions reducing time-to-market and expenses through third-party contractors and eliminating the need to design, assemble and test on the job site. | CSI service is ideal for customers needing complete integrated solutions for backhaul, smart grid and other custom applications. | ||
| New SmartCom |
Highly reliable and robust integrated NEMA 4R outdoor cabinet that secures and provides intelligent back-up power for Utility Smart Grid radio systems. Powers backhaul point-to-point and point to multipoint radios. | Smart grid application that enables utilities to remotely monitor power grid demands and to remotely control line capacitance for efficient power distribution without expensive and timely dispatches. | ||
| New WESTELL BOXER |
A NEMA 3R & 4R compliant extremely universal equipment cabinet with multiple cooling options, independent customers access and rear access panels. | Ideal for broadband and cellular backhaul applications, lower cost fan cooling option or sealed heat exchanger option when needed. | ||
CNS and OSP Segment Research and Development Capabilities and Engineering Base
The Company believes that its future success depends, in part, on its ability to maintain its technological leadership through enhancements of its existing products and development of new products that meet customer needs. Thus, the Company expects to therefore continue to devote substantial resources to product development.
In fiscal years 2010 and 2009, the CNS segment incurred approximately $9.0 million and $15.0 million and the OSP segment incurred approximately $2.3 million and $2.6 million, respectively, on research and development (“R&D”) expense activities. In fiscal year 2008, the combined equipment segments incurred R&D expense of $19.9 million.
The Company’s R&D personnel are organized into product development teams. Each product development team is generally responsible for sustaining technical support of existing products plus conceiving new products in cooperation with other groups within the Company and adapting standard products or technologies to meet new customer needs. Additionally, in an effort to remain a highly valued, superior quality, long-term supplier, each product development team is charged with reducing product costs for each succeeding generation of products without compromising functionality or serviceability. The product development teams leverage the Company’s relationships with its manufacturing partners and suppliers to achieve these cost reduction objectives. As an adjunct to these internal efforts, the Company uses the talents of certain outsourcing firms in India for software development and system testing.
- 4 -
The Company believes that the key to its R&D strategy is choosing an initial architecture for each product that balances innovation and time-to-market factors while enabling engineering innovations to result in future performance enhancements and cost reductions. The Company’s strategy is further enhanced by ensuring products are designed in conjunction with input from customers, procurement, and outsource manufacturing partners and an analysis of the feasibility to reduce costs. The Company believes it has a quality record that is grounded in a solid interface and transference of knowledge among design and manufacturing teams.
The Company’s quality systems, including product development processes, are registered to TL9000, which is the Telecommunication Industry’s sector-specific version of the ISO9001:2000 International Quality System Standard. These processes are also registered to ISO9001:2000. The Company believes product quality is a critical and distinguishing factor in a customer’s selection process.
The Company continues to expand the software content of its CNS products. The majority of the CNS design engineers, including those at the contracted outsourcing firms, are software engineers. Greater software content in the CNS products not only is necessary to deliver the more sophisticated applications, but is also a key element of the strategy to focus on differentiated, value-added products and solutions. In some cases, the Company sources software technology from outside suppliers through licensing agreements which typically, though not always, give the Company the ability to modify the licensed software to meet the needs of the Company’s customers. Some software technology is obtained from the open source community. The Company also develops its own proprietary software where needed to provide the desired functionality. Software from all of these sources is typically integrated into the final product releases, and tested by the Company’s system test engineers, by outside test labs, by industry certification groups, and by the Company’s customers before going into volume production and deployment.
The Company expenses software development costs until its products reach technological feasibility as defined by the software accounting rules. Technological feasibility is established when the product has passed customer lab evaluation, which is just prior to deployment, therefore no software development costs are capitalized.
The following products are the primary products currently under development:
| Product |
Description |
Applications | ||
| HomeCloud (CNS Segment) |
Ultra high-speed applications-capable gateways and other applications-capable devices for the home network, plus associated software for home networking devices, plus Web-based services, to enable the delivery of new services into the home networking environment. | Provides a new suite of new services, beyond voice + video + data, into the home, for a variety of applications, including enhanced security; media and information management, sharing and delivery; home control; and network management. | ||
| eSmartAccess Ethernet Series (OSP Segment) |
Rugged, temperature hardened and optimized for harsh environments for utility companies and service providers for cellular backhaul. | Ideal for utility smart grid and solutions for service provider cellular backhaul. | ||
The Company’s products are subject to industry-wide standardization organizations which include Telcordia, the Internet Engineering Task Force, the MoCA Alliance, the Broadband Forum, CableLabs, the American National Standards Institute (“ANSI”) in the U.S. and the International Telecommunications Union (“ITU”).
CNS and OSP Segment Customers
The CNS and OSP segments principal customers historically have been major U. S. telecommunications service providers (“telephone companies”). In addition, the Company sells products to several other entities, including public telephone administrations located outside the U.S., independent domestic local exchange carriers, competitive local exchange carriers, inter-exchange carriers, wireless service providers, internet service providers, MSOs, and business enterprises.
- 5 -
CNS and OSP Marketing, Sales and Distribution
The Company sells its products in the U.S. through its domestic field sales organization and selected distributors.
The Company markets its products to service providers domestically within the U.S., and Canada.
Major service providers require vendor product approval before use in their networks. Evaluation can take as little as a few months for products that vary slightly from existing products and often longer for products based on new technologies and/or new service offerings. Accordingly, the Company is continually submitting successive generations of its current products, as well as new products, to its customers for approval.
The Company maintains 24-hour, 7-day-a-week telephone support and provides on-site support. The Company also provides technical consulting, research assistance and training to some of its customers with respect to the installation, operation and maintenance of its products.
The CNS and OSP contracts with its major customers are primarily pricing and product specification agreements that detail the commercial terms and conditions for sales. These agreements are requirements based and do not obligate the customer to a specific volume of purchases. The agreements may require the Company to accept returns of products within certain time limits, or indemnify such customers against certain liabilities arising out of the use of the Company’s products. If these claims or returns are significant, there could be a material adverse effect on the Company’s business and results of operations.
Most of the Company’s products carry a limited warranty ranging from one to three years for CNS products and up to seven years for OSP products, which generally covers defects in materials or workmanship and failure to meet published specifications, but excludes damages caused by improper use and all other warranties. In the event there are material deficiencies or defects in the design or manufacture of the Company’s products, the affected products could be subject to recall.
Manufacturing
The Company outsourced its manufacturing operations from Aurora, Illinois, to two primary offshore suppliers during fiscal year 2008. The facility in the Aurora building that was used for manufacturing prior to 2008 is now being used primarily for distribution processes. Reliance on third-party offshore subcontractors involves several risks.
Standard commercial components available from multiple suppliers are procured by the offshore suppliers. There are also single-sourced components and technology needed to produce products. The Company has direct relationships and purchase contracts with suppliers for these items and may maintain inventory for these items at the subcontractors’ locations. Critical components or technology shortages or business interruption at our contract manufacturers could cause production delays that may result in expediting costs or lost business.
A substantial portion of the Company’s shipments in any fiscal period can relate to orders for products received in that period. Further, a significant percentage of orders in the OSP segment may require delivery within 48 hours. To meet this demand, the Company maintains inventory at its facilities and outsource suppliers. In addition, the Company maintains some inventory at customers’ sites. Because of the rapid technological changes to our products, the Company faces a recurring risk that the inventory it holds may become obsolete.
CNS and OSP Competition
The markets for the Company’s products are intensely competitive and the Company has no reason to believe that this competitive environment will ease in the future, especially in the rapidly changing markets for broadband products. The Company’s primary competitors vary by market. The Company’s principal competitors with respect to its OSP products are ADC Telecommunications, Emerson, Purcell and Telect. The Company’s principal competitors with respect to its CNS broadband products are primarily Sagem, Motorola, 2Wire Inc., Cisco Systems Inc. (Linksys), D-Link Systems Inc., Actiontec Electronics Inc., Technicolor (formerly known as “Thomson”) and ZyXEL Communications Co. The Company believes that it is currently one of the leading sellers of broadband CPE products for telecommunication service providers in North America. However, many of the Company’s competitors are significantly larger, with broader product lines, and have more financial resources than the Company. To compete against these competitors, the Company focuses on quality, time-to-market, and the ability to react quickly to market changes, leveraging its U.S. based product management and product development teams. The Company expects that continuing competitive pressure from Asian-based manufacturers will continue to exert downward pressure on pricing.
- 6 -
Since the Company currently derives the majority of its total revenues from the sale of products to telephone companies, the Company faces less direct competition from alternative products optimized for other broadband networks. Telephone companies face competition from MSOs, new local access providers and broadband wireless service providers that are capable of providing high speed digital transmission to end users. In addition, the Company believes that the deployment of DSL, HDSL, Ethernet and fiber networks are reducing the demand for the Company’s traditional OSP transmissions products. (See Risk Factors)
Backlog
Product shipments are generally made pursuant to standard purchase orders, which are officially acknowledged according to standard terms and conditions. CNS segment purchase orders with scheduled shipment dates within 60 days are generally firm and non-cancellable. The majority of purchase orders with shipment dates in excess of 60-90 days allow for partial or full cancellation. Shipment dates on non-cancellable purchase orders can be adjusted by some customers on request. OSP segment purchase orders are generally received less than a month prior to shipment.
As of May 13, 2010, the CNS and OSP segments had $8.7 million and $4.0 million of backlog, respectively. As of June 3, 2009, the CNS and OSP segments had $15.3 million and $2.7 million of backlog, respectively.
ConferencePlus Segment
Conference Plus, Inc. (“ConferencePlus” or “CP”), founded in 1988, is a full-service audio, web and video conferencing company that manages and hosts specific software and applications supporting its conferencing and meeting services. ConferencePlus is a 100% owned subsidiary of the Company and manages its conferencing and meeting services through its main operations center in Schaumburg, Illinois, and a facility in Dublin, Ireland. During December 2008, ConferencePlus became a wholly owned subsidiary when the Company purchased the remaining 8.5% minority interest.
ConferencePlus allows multiple individuals, organizations and/or businesses to conduct conference calls using a combination of audio, web and video collaboration and presentations. ConferencePlus offers conference call services that can include a blend of audio, graphics, spreadsheets and other documents that can be carried over and archived on the Internet to enhance the traditional audio conference call. By enabling the sharing of this blend of information, ConferencePlus can help organizations increase productivity and save money by reducing travel time, bringing down travel costs, and making it easier for people in remote locations to work together. Conferencing and meeting service technologies also allow organizations and individuals to collect and disseminate information faster, more accurately and without the associated costs of face-to-face meetings. These technologies also help companies communicate and collaborate effectively in the face of health and safety threats and other impediments to travel and formal gatherings.
ConferencePlus Customers - Diverse Distribution Channels
ConferencePlus has historically acted as a provider of conferencing and meeting services on a wholesale basis, managing and hosting applications for major carriers and telecommunications resellers. About 30% of ConferencePlus’ revenues come from indirect commercial conferencing services to customers who market or use ConferencePlus services under their own brand names. Such companies choose to outsource and private label audio, web and video conferencing services to maintain continuity, save costs and focus on their core competencies. By selling to indirect or resale customers, ConferencePlus effectively increases the size of its sales organization without incurring the expense necessary with a direct sales force.
- 7 -
ConferencePlus Sales
ConferencePlus also sells its services directly to companies through its national accounts sales force. This area continues to be a strong part of ConferencePlus’ business and the Company expects to continue to invest resources in this area in order to maintain a diverse mix of revenue sources. The deployment of this strategy is designed to improve the recognition of the ConferencePlus brand, which has strategic long term benefits to the Company.
ConferencePlus Research and Development - State-of-the-Art Network and Integrated Systems
The ConferencePlus segment incurred approximately $2.2 million, $2.2 million and $2.4 million, respectively, of research and development expense activities in fiscal year 2010, 2009 and 2008, respectively.
A critical part of ConferencePlus’ approach is its state-of-the-art network and integrated systems. ConferencePlus has a state-of-the-art network infrastructure that enables it to take advantage of the relationships it has with major telecommunications providers to provide quality service. ConferencePlus has deployed equipment in carrier Points-of-Presence to take advantage of the higher capacity and the lower cost structure available with such deployments.
The Company has also deployed equipment into customer datacenters to leverage existing investments in next-generation VoIP corporate networks. These deployments provide all of the advantages ConferencePlus provides through traditional service provider solutions while allowing these Customers to benefit from the elimination of variable telecommunication costs.
ConferencePlus has built an integrated reservation, scheduling and billing system called Conference Reservation and Billing System (“CRBS”) that is a significant differentiator in the conferencing market. CRBS allows ConferencePlus to leverage its operations on a global basis. This reliable and scalable system is seamlessly integrated into the operational environment from the point of reservation through the billing process. This integration allows ConferencePlus to enjoy scale advantages and to be able to provide transparent branded services to its customers. This system is built and maintained by an in-house team of engineers, developers and technicians who continually work to improve and enhance the system based on industry trends, customer requests and strategic direction.
ConferencePlus has extended certain capabilities of CRBS to a publicly available web portal where customers can sign up for service, manage their accounts and control their conferences. ConferencePlus has also tightly integrated with third-party suppliers of web conferencing services to enhance its audio services. In addition to making these services available to customers, ConferencePlus has the ability to privately brand the entire web experience to match any other brand visualization that may be required. This capability is beneficial for both indirect customers where this helps support the indirect brand as well as for customers where branding can help drive corporate adoption.
ConferencePlus International Reach
As customers globalize their telecommunications services, ConferencePlus has expanded its operational presence internationally to meet these needs. In addition to its main operational centers in Schaumburg, Illinois and Dublin, Ireland, ConferencePlus has conferencing bridges located in Oakbrook, Illinois; New York, New York; Dallas, Texas; London, England; Stockholm, Sweden and Kuala Lumpur, Malaysia. The international market for conferencing is expected to grow as a result of deregulation and improved networks with associated reductions in end user costs.
ConferencePlus’ indirect or private label customers and many of its other customers are significantly larger than, and are thus able to exert a high degree of influence over, ConferencePlus. ConferencePlus depends on large customers to provide a significant percent of its revenues. Although the Company has focused on broadening its customer base, a loss of one of these customers would have a material adverse effect on ConferencePlus’ business. Prior to selling its services, ConferencePlus may be required to undergo lengthy approval and purchase processes. Evaluation can take a few months for services that vary slightly from existing services used by the prospective customer to a year or more for services based on cutting edge technologies or which represent a new strategic direction for the customer, as is the case with private labeling conference services for a large reseller.
- 8 -
ConferencePlus Competition
Competition in the conferencing business is intense and ConferencePlus expects that competition will increase due to low barriers to entry and recent entrants into the audio, web and video conferencing service market. Many of ConferencePlus’ competitors, including InterCall, AT&T, Verizon, Premiere and British Telecom, have much greater name recognition, more extensive customer service and marketing capabilities and substantially greater financial, technological and personnel resources than ConferencePlus. There can be no assurance that ConferencePlus will be able to successfully compete in this market in the future or that competitive pressures will not result in price reductions that would materially adversely affect its business and results of operations.
International Revenue
Revenues from international customers represented approximately $11.1 million, $9.1 million and $8.9 million of the Company’s revenues in fiscal years 2010, 2009, and 2008, respectively, which represents approximately 6.1%, 4.9% and 4.3% of the Company’s total revenues in such years.
Major Customers
The Company depends, and will continue to depend, on the telephone companies and other independent local exchange carriers for the majority of its revenues. Sales to the Company’s largest two customers, Verizon and AT&T, accounted for 41.6% and 13.4% of the Company’s total revenues in fiscal year 2010, respectively.
Proprietary Rights and Intellectual Property
The Company’s success and future revenue growth will depend, in part, on its ability to protect trade secrets, obtain or license patents and operate without infringing on the rights of others. The Company relies on a combination of technical leadership, copyrights, patents, trademarks, trade secrets and other intellectual property laws, nondisclosure agreements and other protective measures to protect its unpatented proprietary know-how. The Company regards some of its technology as proprietary. The expiration of any of the patents held by the Company would not have a material impact on the Company. The Company expects to seek additional patents from time to time related to its research and development activities.
Employees
As of May 13, 2010, the Company had 380 full-time employees. The following table reflects headcount by segment and functional area:
| CNS | OSP | CP | Total | |||||
| Operations |
11 | 38 | 101 | 150 | ||||
| Sales and marketing |
24 | 26 | 53 | 103 | ||||
| Research and development |
29 | 18 | 21 | 68 | ||||
| General and administrative |
11 | 11 | 37 | 59 | ||||
| Total employees |
75 | 93 | 212 | 380 | ||||
Available Information
The SEC maintains an internet site, www.sec.gov, through which you may access the Company’s annual report on Form 10-K, quarterly reports on Form 10-Q, current reports on Form 8-K, proxy and other information statements, as well as amendments to these reports. In addition, the Company makes these reports available free of charge on the Company’s internet website, www.westell.com. The Company maintains a corporate governance page on the Company’s website. This website includes, among other items, the Code of Business Conduct, the Audit Committee Charter, and the Compensation and Corporate Governance Committee Charter. The corporate governance information can be found at www.westell.com under Investor Relations.
- 9 -
| ITEM 1A. | RISK FACTORS |
You should carefully consider the risks described below in addition to the other information contained and incorporated by reference in this Form 10-K. If any of the following risks occurs, our business, operating results or financial condition would likely suffer, and the market price for our securities could decline.
Risks Related to Our Business
General economic conditions may affect our results.
The global economy has been undergoing a period of unprecedented volatility, which has affected the demand for our equipment and services. A prolonged period of economic decline could have a material adverse effect on our results of operations and financial condition. The Company may experience a decrease in purchases or usage of our products and services if increased unemployment leads to lower utilization of telecommunications, internet services and conferencing services. Customers may stop or decrease purchasing due to efforts to reduce inventory and conserve cash. The Company may also experience business disruptions due to an inability to obtain equipment, parts and supplies from suppliers if fragile supply businesses fail.
We depend on a limited number of customers who are able to exert a high degree of influence over us and loss of a major customer could adversely impact our business.
We have and will continue to depend on U.S. telephone companies for the majority of our revenues in our CNS and OSP equipment segments. Sales to the two largest telephone company customers accounted for approximately 55%, 57% and 54% of our revenues in fiscal year 2010, 2009 and 2008, respectively. Consequently, our future success may depend upon retaining such customers.
The telephone companies and our other customers are significantly larger than we are and are able to exert a high degree of influence over us. These customers may often be permitted to reschedule orders without penalty. Even if demand for our products is high, the telephone companies have sufficient bargaining power to demand low prices and other terms and conditions that may materially adversely affect our business and operating results.
ConferencePlus’ customer base is concentrated; its top twenty-five customers represent a large portion of total revenue. ConferencePlus’ customers continually undergo review and evaluation of their conferencing and meeting services to evaluate the merits of alternative outsourcing or of bringing those services in-house rather than outsourcing them. There can be no assurance in the future that ConferencePlus’ customers will not develop their own internal conferencing and meeting services. ConferencePlus must continually provide higher quality, lower cost services to maintain and grow its customer base. A loss of a major account could have a material adverse effect on ConferencePlus.
Overall sales and product mix sold to our large customers have fluctuated in the past and could vary in the future resulting in significant fluctuations in quarterly operating results and may adversely impact our stock price.
We have long-term customer pricing contracts with a limited amount of coverage by way of long-term contracts or arrangements with suppliers, which could adversely affect our ability economically or with certainty to purchase components and technologies used in our products.
Although we have long-term customer pricing contracts, we have few long-term contracts or arrangements with our suppliers. We may not be able to obtain components at competitive prices, in sufficient quantities or under other commercially reasonable terms. If we enter into a high-volume or long-term supply arrangement and subsequently decide that we cannot use the products or services provided for in the supply arrangement then our business would also be harmed. We enter into short-term contracts with our suppliers in the form of purchase orders. Purchase orders are often non-cancellable within contractual time periods. These purchase orders are issued to vendors based on forecasted customer demand. If the forecasted demand is materially incorrect, we may find that we cannot use the products ordered, and then our business would also be harmed.
- 10 -
Our lack of backlog may affect our ability to adjust for unexpected changes in customer demand.
OSP customers often place orders for product within a month of their requested delivery date. CNS customers generally place orders with more advance notice, but have the right of to cancel those orders within 60 days prior to shipment. We therefore do not have a material backlog (or known quantity) of unfilled orders, and our revenues in any quarter are substantially dependent on orders booked or orders becoming non-cancellable in that quarter. Our expense levels and inventory commitments are based on anticipated customer demand and are relatively fixed in the short term. Therefore, we may be unable to cancel purchase orders with our suppliers or adjust spending in a timely manner to compensate for any unexpected shortfall of orders. Accordingly, any significant shortfall of demand in relation to our expectations or any material delay of customer orders would have an immediate adverse impact on our business and operating results.
Conversely, if we order too little product to meet customer demand, we may have insufficient inventory which could result in unplanned expediting costs or lost revenue opportunities, either of which could have an adverse impact on our financial results.
Due to the rapid pace of technological change and volatile customer demand, our products may become obsolete and could cause us to incur charges for excess and obsolete inventory which would materially harm our business.
The telecommunications industry is subject to rapid technological change and volatile customer demands, which could result in inventory obsolescence or excess inventory. As a result, we have in the past and may in the future devote disproportionate resources to a product that we ultimately may not sell or have to sell for a loss. If we incur substantial inventory impairments that we are not able to recover because of changing market conditions, it could have a material adverse effect on our business, financial condition and results of operations.
Our products and services face intense competition. Our failure to compete successfully could materially affect our profitability.
Because we are significantly smaller than many of our competitors, we may lack the financial, marketing, technical and other resources needed to increase our market share. Many of our competitors are much larger than we are and may be able to offer a wider array of products and services required for a service provider’s business than we do.
Competitors may succeed in establishing technologically advanced products and services with more favorable pricing or may otherwise gain an advantage over our products which would result in lost business that would adversely impact our profitability.
Because of intense competition, we may price our products and services at low margins in order to win or maintain business. Low margins from our sales of products and services could materially and adversely affect our profitability and ability to implement our business goals.
We may experience delays in the development and deployment of new products.
Many of our past sales have resulted from our ability to anticipate changes in technology, industry standards and service provider service offerings, and to develop and introduce new and enhanced products and services. Our continued ability to adapt to such changes will be a significant factor in maintaining or improving our competitive position and our prospects for growth.
There can be no assurance that we will successfully introduce new products on a timely basis or achieve sales of new products in the future. In addition, there can be no assurance that we will have the financial and product design resources necessary to continue to successfully develop new products or to otherwise successfully respond to changing technology standards and service provider service offerings. If we fail to deploy new products on a timely basis, then our product sales will decrease and our competitive position and financial condition would be materially and adversely affected.
- 11 -
Our customers have lengthy purchase cycles that affect our ability to sell our products.
Prior to selling products to service providers, we must undergo lengthy approval and purchase processes. Evaluation can take as little as a few months for products that vary slightly from existing products or up to a year or more for products based on new technologies or utilized for new service offerings. Accordingly, we are continually submitting successive generations of our current products as well as new products to our customers for approval.
The requirement that service providers obtain FCC or state regulatory approval for most new telecommunications and broadband services prior to their implementation has in the past delayed the approval process. Such delays in the future could have a material adverse affect on our business and operating results. While we have been successful in the past in obtaining product approvals from our customers, there is no guarantee that such approvals or that ensuing sales of such products will continue to occur.
We are dependent on third-party technology, the loss of which would harm our business.
We rely on third parties technology in our products and to deliver our services. Consequently, the Company must rely upon third parties to develop and to introduce technologies which enhance the Company’s current products and services and enable the Company, in turn, to develop its own products and provide services on a timely and cost-effective basis to meet changing customer needs and technological trends in the telecommunications industry. Were the Company to lose the ability to obtain needed technology from a supplier, or were that technology no longer available to the Company under reasonable terms and conditions, the Company’s business and results of operations would be materially and adversely affected.
Potential product recalls, service failures and warranty expenses could adversely affect our profitability.
Our products and services are required to meet rigorous standards imposed by our customers, and we warrant the performance of these products and services. In addition, our supply contracts with our major customers typically require us to accept returns of products within certain time frames and indemnify such customers against certain liabilities arising out of the use of our products or services. Complex products such as those offered by us may contain undetected defects or failures when first introduced or as new versions are released. Despite our testing of products and our comprehensive quality control program, there is no guarantee that our products will not suffer from defects or other deficiencies. If product defects, recalls, warranty returns, service failures, indemnification or liquidated-damage claims exceed our anticipated costs for these items, our business could be harmed. Such claims and the associated negative publicity could result in the loss of or delay in market acceptance of our products and services, and could affect our product and service sales, our customer relationships, and our profitability.
We are dependent on sole or limited source suppliers, the loss of which would harm our business.
Components used in our products may be currently available from only one source or a limited number of suppliers. Our inabilities to obtain sufficient key components or to develop alternative sources for key components as required, could result in delays or reductions in product deliveries, and consequently severely harm our customer relationships and our business. Furthermore, additional sole-source components may be incorporated into our future products, thereby increasing our supplier risks. If any of our sole-source suppliers delay or halt production of any of their components, or fail to supply their components on commercially reasonable terms, then our business and operating results would be harmed.
In the event that these suppliers discontinued the manufacture of materials used in our products, we would be forced to incur the time and expense of finding a new supplier if available or modify our products in such a way that such materials were not necessary, which could result in increased manufacturing costs.
We are dependent on our independent offshore outsource manufacturing partners to manufacture, assemble and test our products. If these companies do not meet their commitments to us, it could adversely impact our ability to meet the delivery requirements of our customers, which could result in lost business.
In fiscal year 2008, the Company moved substantially all of the manufacturing of CNS and OSP products from Aurora, Illinois, to offshore suppliers in Asia. Although there is no unique capability with these suppliers, any failure or business disruption by these suppliers to meet delivery commitments would cause us to delay shipments and potentially lose revenue.
- 12 -
Business interruption could prevent our ability to deliver products and services to our customers and could adversely affect our business.
We rely on subcontractors in Asia for assembly and testing of and to purchase some of the raw materials used in such assemblies. The reliance on third-party subcontractors for assembly of our products involves several risks, including the unavailability of, or interruptions in access to, certain process technologies and reduced control over product quality, delivery schedules, transportation, manufacturing yields, and costs. These risks may be exacerbated by economic or political uncertainties, terrorist actions, or by natural pandemics in countries in which our subcontractors are located. Contracts with our outsource manufacturing partners are in U.S. dollars.
ConferencePlus maintains call centers and bridging equipment in the United States, Ireland and Great Britain. If any of the call centers or bridging equipment was unavailable due to natural or other disaster, then our business could be harmed.
Because ConferencePlus conducts a substantial amount of business on the internet, its systems can be the target of cyber-attacks or hacking for the purpose of gaining access to information or fraudulently using the services. Such attacks, if not properly detected and defended against, can result in business interruption and other harm to the business.
We may be subject to litigation that could be costly to defend and could impact our profitability.
Our products and services use third party and open source intellectual property. The telecommunications industry is characterized by the existence of an increasing number of patents and frequent litigation based on allegations of patent and other intellectual property infringement. From time to time we receive communications from third parties alleging infringement of exclusive patent, copyright and other intellectual property rights to technologies that are important to us. Such litigation, regardless of its outcome, could result in substantial costs and thus adversely impact our profitability.
We could face securities litigation in the future that could result in the payment of substantial damages or settlement costs in excess of our insurance coverage. Any adverse outcome could harm our business. Even if we were to prevail in any such litigation, we could incur substantial legal costs and management’s attention and resources could be diverted from our business which could cause our business to suffer.
We will not be able to successfully compete, develop and sell products and services if we fail to retain key personnel and hire additional key personnel.
Because of our need to continually compete for customer business, our success is dependent on our ability to attract and retain qualified technical, marketing, sales and management personnel. To remain competitive, we must maintain top management talent, employees who are involved in product development and testing and employees who have developed strong customer relationships. Because of the high demand for these types of employees, it may be difficult to retain existing key employees and attract new key employees. In addition we do not have non-compete contracts with most of our employees. Our inability to attract and retain additional key employees could harm our ability to successfully sell existing products and services, develop new products and services, and implement our business goals.
Industry consolidation and divestiture and could make competing more difficult.
Consolidation of companies offering competing products and services is occurring through acquisitions, joint ventures and licensing arrangements involving our competitors, our customers and our customers’ competitors.
Our customers have been divesting certain territories to other telecommunication service providers. The acquiring companies often use competitor products in their legacy business. We are often required to formally bid to retain existing business or obtain new business in the acquirer’s territory.
- 13 -
We cannot provide any assurances that we will be able to compete successfully in an increasingly consolidated telecommunications industry or retain or win business when existing customers divest portions of their business to others. Any heightened competitive pressures that we may face may have a material adverse effect on our business, prospects, financial condition and result of operations.
Our services are affected by uncertain government regulation and changes in current or future laws or regulations could restrict the way we operate our business.
The telecommunications industry, including most of our customers, is subject to regulation from federal and state agencies, including the FCC and various state public utility and service commissions. While these regulations do not affect us directly, the effects of regulations on our customers may adversely impact our business and operating results. For example, FCC regulatory policies affecting the availability of telephone company services and other terms on which telephone companies conduct their business may impede our penetration of local access markets, and/or make the markets less financially attractive.
We have incurred losses in the past and may incur losses in the future.
We incurred losses in the fiscal years ended March 31, 2009 and 2008 and historically in fiscal years through 2002. The Company had an accumulated deficit of $309.0 million as of March 31, 2010.
We also expect to continue to evaluate new product opportunities. As a result, we will continue to invest in research and development and sales and marketing, which could adversely affect our short-term operating results. We can offer no assurances that we will remain profitable in the future.
We may engage in future acquisitions or fund raising activity that could impact our financial results or stock price.
We expect to continue to review potential acquisitions and we may acquire or make investments in businesses, products or technologies in the future. Any substantial future acquisitions or investments would present a number of risks that could harm our business including:
| • | business integration issues; |
| • | disruption to our ongoing and acquired business; |
| • | difficultly realizing the intended benefits of the transaction; and |
| • | impairment of assets related to resulting goodwill and acquired intangibles. |
We expect that consideration for potential acquisitions or investments to be paid in cash, common stock or a combination of both. If consideration is paid in common stock, this would dilute the ownership of our existing shareholders.
Availability of our deferred tax assets could be limited by an ownership change as defined by Section 382 of the Internal Revenue Code, or by a change in the tax code.
We have significant deferred tax assets, primarily in the form of net operating losses, which are generally available to offset future taxable income or income tax. A change in ownership, as defined by Section 382 of the Internal Revenue Code, could reduce the availability of those tax assets.
Risks Related to our Common Stock
Our stock price is volatile and could drop unexpectedly.
Like many technology companies, our stock price has demonstrated and may continue to demonstrate volatility as valuations, trading volume and prices move significantly. This volatility may result in a material decline in the market price of our securities, and may have little relationship to our financial results or prospects.
- 14 -
Our Class A Common Stock could be delisted from the NASDAQ Global Select Market.
NASDAQ has established certain standards for the continued listing of a security on the NASDAQ Global Select Market. The standards for continued listing include, among other things, that the minimum bid price for the listed securities be at least $1.00 per share. Although the Company is currently in compliance with the minimum bid price requirement, in the future we may not satisfy the NASDAQ’s continued listing standards. If we do not satisfy any of the NASDAQ’s continued listing standards, the Company’s Class A Common Stock could be delisted. Any such delisting could adversely affect the market liquidity of our Class A Common Stock and the market price of our Class A Common Stock could decrease. A delisting could adversely affect our ability to obtain financing for our operations and/or result in a loss of confidence by investors, customers, suppliers or employees.
We have been and could be the subject of future investigation by the SEC or other governmental authorities that could adversely affect our financial condition, results of operations and the price of our common stock.
In the past, the SEC conducted an investigation regarding events and circumstances surrounding trading in our securities. In August 2009, the SEC informed us that it had completed this investigation without any enforcement action. In the event that a future investigation leads to significant legal expense or to action against the Company or its directors and officers our financial condition, results of operations and the price of our common stock may be adversely impacted.
Our principal stockholders can exercise significant influence that could discourage transactions involving a change of control and may affect your ability to receive a premium for Class A Common Stock that you purchase.
As of May 13, 2010, as trustees of a voting trust containing common stock held for the benefit of the Penny family and the Simon family, Robert C. Penny III and Melvin J. Simon have the exclusive power to vote over 49.1% of the votes entitled to be cast by the holders of our common stock. In addition, members of the Penny family who are beneficiaries under this voting trust are parties to a stock transfer restriction agreement which prohibits the beneficiaries from transferring any class B common stock or their beneficial interests in the voting trust without first offering such class B common stock to the other Penny family members. Certain Penny family members also own or are beneficiaries of trusts that own shares outside of the voting trust. As trustees of the Voting Trust and other trusts, Messrs. Penny and Simon control 53.1% of the stock vote. Consequently, we are effectively under the control of Messrs. Penny and Simon, as trustees, who can effectively control the election of all of the directors and determine the outcome of most corporate transactions or other matters submitted to the stockholders for approval. Such control may have the effect of discouraging transactions involving an actual or potential change of control, including transactions in which the holders of Class A Common Stock might otherwise receive a premium for their shares over the then-current market price.
- 15 -
| ITEM 1B. | UNRESOLVED STAFF COMMENTS |
None.
| ITEM 2. | PROPERTIES |
The Company leases the following real property:
| Location |
Purpose |
Square footage | Termination year | |||
| Aurora, IL |
Office and distribution | 185,000 | 2017 | |||
| Schaumburg, IL |
Office, Conferencing Services | 41,860 | 2013 | |||
| Dublin, Ireland |
Office, Conferencing Services | 2,000 | 2024 | |||
| Regina, Saskatchewan, Canada |
Office and manufacturing | 24,000 | 2012 |
A portion of the Aurora facility is used as a product distribution operation and alternative uses are currently being explored for portions of the Aurora facility that exceed the Company’s requirements.
The Company does not own any real property.
| ITEM 3. | LEGAL PROCEEDINGS |
The Company is involved in various legal proceedings incidental to the Company’s business. In the ordinary course of our business, we are routinely audited and subject to inquiries by governmental and regulatory agencies.
Management believes that the outcome of such proceedings will not have a material adverse effect on our consolidated operations or financial condition.
| ITEM 4. | (REMOVED AND RESERVED) |
- 16 -
PART II
| ITEM 5. | MARKET FOR REGISTRANT’S COMMON EQUITY, RELATED STOCKHOLDER MATTERS AND ISSUER PURCHASES OF EQUITY SECURITIES |
The Company’s Class A Common Stock is quoted on the NASDAQ Global Select Market under the symbol “WSTL”. The following table sets forth for the periods indicated the high and low sale prices for the Class A Common Stock as reported on the NASDAQ Global Select Market.
| High | Low | |||||
| Fiscal Year 2009 |
||||||
| First Quarter ended June 30, 2008 |
$ | 1.83 | $ | 1.20 | ||
| Second Quarter ended September 30, 2008 |
1.38 | 0.02 | ||||
| Third Quarter ended December 31, 2008 |
0.73 | 0.13 | ||||
| Fourth Quarter ended March 31, 2009 |
0.37 | 0.21 | ||||
| Fiscal Year 2010 |
||||||
| First Quarter ended June 30, 2009 |
$ | 0.64 | $ | 0.27 | ||
| Second Quarter ended September 30, 2009 |
1.57 | 0.56 | ||||
| Third Quarter ended December 31, 2009 |
1.88 | 0.96 | ||||
| Fourth Quarter ended March 31, 2010 |
1.52 | 1.17 | ||||
As of May 13, 2010, there were approximately 825 holders of record of the outstanding shares of Class A Common Stock and five holders of record of Class B Common Stock.
During the fiscal year ended March 31, 2010, no equity securities of the Company were sold by the Company that were not registered under the Securities Act of 1933, as amended.
Dividends
The Company has never declared or paid any cash dividends on its common stock and does not anticipate paying any cash dividends in the foreseeable future. In addition, the Company’s credit facility restricts the Company’s ability to pay dividends without bank approval.
Issuer Purchases of Equity Securities
In March 2008, the Board of Directors authorized a share repurchase program whereby the Company may repurchase up to an aggregate of $10.0 million of its outstanding Class A Common Stock. On March 3, 2010, the scheduled expiration date of that program, the unused availability of $6,903,115 expired unused. In February 2010, the Board of Directors authorized a share repurchase program whereby the Company may repurchase up to an aggregate of $10.0 million of its outstanding Class A Common Stock. There were no share repurchases during the fourth quarter of fiscal year 2010. As of March 31, 2010, there was $10.0 million available for stock repurchases under the approved program.
- 17 -
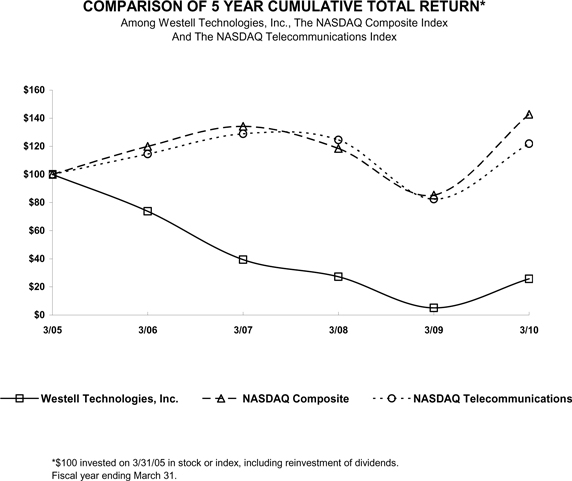
Performance Graph
The following performance graph compares the change in the Company’s cumulative total stockholder return on its Class A Common Stock with the cumulative total return of the NASDAQ Composite Index and the NASDAQ Telecommunications Index for the period commencing March 31, 2005 and ending March 31, 2010. The stock price performance shown in the performance graph may not be indicative of future stock price performance.
| 3/05 | 3/06 | 3/07 | 3/08 | 3/09 | 3/10 | |||||||
| Westell Technologies, Inc. |
100.00 | 73.87 | 39.38 | 27.22 | 5.08 | 25.77 | ||||||
| NASDAQ Composite |
100.00 | 119.97 | 134.27 | 118.46 | 85.30 | 142.80 | ||||||
| NASDAQ Telecommunications |
100.00 | 114.55 | 128.92 | 124.54 | 82.46 | 121.90 |
- 18 -
| ITEM 6. | SELECTED FINANCIAL DATA |
The following selected consolidated financial data as of March 31, 2010, 2009, 2008, 2007 and 2006 and for each of the five fiscal years in the period through fiscal year 2010 have been derived from the Company’s Consolidated Financial Statements, which have been audited by Ernst & Young LLP. The data set forth below is qualified by reference to, and should be read in conjunction with, “Management’s Discussion and Analysis of Financial Condition and Results of Operations”, the Consolidated Financial Statements and the related Notes thereto and other financial information appearing elsewhere in this Annual Report on Form 10-K.
| (in thousands, except per share data) | Fiscal Year Ended March 31, | |||||||||||||||||||
| 2010 | 2009 (a) | 2008 | 2007 | 2006 | ||||||||||||||||
| Statement of Operations Data: |
||||||||||||||||||||
| Revenue |
$ | 181,485 | $ | 185,916 | $ | 205,729 | $ | 256,533 | $ | 278,849 | ||||||||||
| Cost of equipment revenue and services |
123,796 | 134,742 | 145,289 | 173,107 | 194,986 | |||||||||||||||
| Gross profit |
57,689 | 51,174 | 60,440 | 83,426 | 83,863 | |||||||||||||||
| Operating expenses: |
||||||||||||||||||||
| Sales and marketing |
17,987 | 24,153 | 24,067 | 29,422 | 23,677 | |||||||||||||||
| Research and development |
13,608 | 19,854 | 22,350 | 24,144 | 19,766 | |||||||||||||||
| General and administrative |
15,095 | 20,036 | 21,537 | 17,354 | 15,054 | |||||||||||||||
| Goodwill impairment |
— | 1,381 | 9,651 | — | — | |||||||||||||||
| Intangible amortization |
641 | 1,882 | 1,834 | 1,699 | 1,386 | |||||||||||||||
| Restructuring |
609 | 752 | 5,717 | 343 | 443 | |||||||||||||||
| Total operating expenses |
47,940 | 68,058 | 85,156 | 72,962 | 60,326 | |||||||||||||||
| Operating income (loss) |
9,749 | (16,884 | ) | (24,716 | ) | 10,464 | 23,537 | |||||||||||||
| Other income (expense), net |
25 | 662 | 3,709 | 3,173 | 1,559 | |||||||||||||||
| Interest (expense) |
(5 | ) | (15 | ) | (12 | ) | (7 | ) | (12 | ) | ||||||||||
| Income (loss) before income taxes, minority interest and discontinued operations |
9,769 | (16,237 | ) | (21,019 | ) | 13,630 | 25,084 | |||||||||||||
| Income taxes |
558 | (77 | ) | (53,495 | ) | (5,474 | ) | (10,784 | ) | |||||||||||
| Minority interest |
— | (74 | ) | (260 | ) | (235 | ) | (304 | ) | |||||||||||
| Net income (loss) from continuing operations |
10,327 | (16,388 | ) | (74,774 | ) | 7,921 | 13,996 | |||||||||||||
| Income (loss) from discontinued operations, net of tax of $— , $0, $ 208, $ 418 and $ 672, respectively |
— | (206 | ) | (1,456 | ) | 773 | (1,149 | ) | ||||||||||||
| Net income (loss) |
$ | 10,327 | $ | (16,594 | ) | $ | (76,230 | ) | $ | 8,694 | $ | 12,847 | ||||||||
| Basic net income (loss) per share: |
||||||||||||||||||||
| Basic net income (loss) from continuing operations |
$ | 0.15 | $ | (0.24 | ) | $ | (1.06 | ) | $ | 0.11 | $ | 0.20 | ||||||||
| Basic net income (loss) from discontinued operations |
$ | — | $ | (0.00 | ) | $ | (0.02 | ) | $ | 0.01 | $ | (0.02 | ) | |||||||
| Basic net income (loss) per share |
$ | 0.15 | $ | (0.24 | ) | $ | (1.08 | ) | $ | 0.12 | $ | 0.18 | ||||||||
| Average number of basic common shares outstanding |
67,987 | 69,470 | 70,376 | 69,946 | 69,440 | |||||||||||||||
| Diluted net income (loss) per share |
||||||||||||||||||||
| Diluted net income (loss) from continuing operations |
$ | 0.15 | $ | (0.24 | ) | $ | (1.06 | ) | $ | 0.11 | $ | 0.20 | ||||||||
| Diluted net income (loss) from discontinued operations |
$ | — | $ | (0.00 | ) | $ | (0.02 | ) | $ | 0.01 | $ | (0.02 | ) | |||||||
| Diluted net income (loss) per share |
$ | 0.15 | $ | (0.24 | ) | $ | (1.08 | ) | $ | 0.12 | $ | 0.18 | ||||||||
| Average number of diluted common shares outstanding |
68,573 | 69,470 | 70,376 | 71,144 | 71,529 | |||||||||||||||
| Balance Sheet Data (at end of period): |
||||||||||||||||||||
| Cash and cash equivalents |
$ | 61,315 | $ | 46,058 | $ | 65,747 | $ | 70,183 | $ | 40,928 | ||||||||||
| Working capital (b) |
17,959 | 19,001 | 13,317 | 18,248 | 35,614 | |||||||||||||||
| Total assets |
121,834 | 115,564 | 134,228 | 207,350 | 191,813 | |||||||||||||||
| Total stockholders’ equity |
$ | 87,731 | $ | 76,448 | $ | 93,495 | $ | 167,339 | $ | 157,276 | ||||||||||
| (a) | As adjusted, see Note 3 to the Consolidated Financial Statements. |
| (b) | Working capital is defined as current assets less cash and cash equivalents and current liabilities. |
- 19 -
| ITEM 7. | MANAGEMENT’S DISCUSSION AND ANALYSIS OF FINANCIAL CONDITION AND RESULTS OF OPERATIONS |
Overview
The following discussion should be read together with the Consolidated Financial Statements and the related Notes thereto and other financial information appearing elsewhere in this Form 10-K. All references herein to the term “fiscal year” shall mean a year ended March 31 of the year specified.
The Company commenced operations in 1980 as a provider of telecommunications network transmission products that enable advanced telecommunications services over copper telephone wires. Until fiscal 1994, the Company derived substantially all of its revenues from its Outside Plant Systems (“OSPlant Systems” or “OSP”) products, particularly the sale of NIU products and related products. The Company introduced its first Customer Networking Solutions (“CNS”) products in fiscal 1993. The Company has also provided audio teleconferencing services since fiscal 1989 through its Conference Plus, Inc. subsidiary. The Company realizes the majority of its revenues from the North American market.
Prior to fiscal year 2009, the Company conducted its business within two reportable segments of telecom equipment and telecom services. Effective in the third quarter of fiscal year 2009, the Company began reporting its financial information within the three reportable segments of CNS, OSP, and ConferencePlus. In fiscal year 2008, CNS and OSP products were both manufactured in the Aurora manufacturing facility and shared significant resources that were note segregated for financial reporting. As a result, the Company determined that it is impracticable for the Company to restate fiscal year 2008 to conform to the current operating segments. In order to provide comparable information, the Company has combined the CNS and OSP segments results for fiscal years 2010 and 2009.
In the CNS segment, the Company designs, distributes, markets and services a broad range of carrier-class broadband products. The CNS family of broadband products enables high-speed transport and networking of voice, data, video, and other advanced services. The products allow service providers to deliver services, content, and applications over existing copper, fiber, coax, and wireless infrastructures. Westell CNS products are typically installed in consumer residences or small businesses as a key component of a broadband service package.
CNS Products. The Company’s CNS products enable residential customers, small businesses, and small office/home office (“SOHO”) users to access and share broadband services on networked computers, telephones, cell phones, televisions, media players, and other networked devices. A broad offering of networking products and technologies allows the Company to address several segments of the service provider market, distinguished by the methods used to deliver their services: wireline operators (copper and fiber), mobile network operators (“wireless”), cable multi-service operators (hybrid fiber-coax), and integrated carriers that operate as combinations of the other three operators.
In the OSP segment, the Company designs, distributes, markets and services a broad range of carrier-class digital transmission, remote monitoring, power distribution and demarcation products. The Company’s OSP products offer next-generation outdoor cabinets, enclosures, power distribution panels, flexible edge connectors (fiber, Ethernet and coax), remote monitoring solutions, and DS1 and DS3 transmission plugs. These solutions are optimized for wireless backhaul, service delivery to business enterprise and smart grid applications. The OSP team also provides a value-added Customized Systems Integration (“CSI”) service, offering its customers a single source for complete turnkey solutions, reducing the time-to-market and expenses incurred through third-party contractors and eliminating the need to design, assemble and test on the job site. Our target customers include wireline service providers, wireless service providers, multiple systems operators (“MSOs”), integrated carrier, utility providers and original equipment manufacturers (“OEMs”) worldwide (all known as “service providers”). The power distribution and remote monitoring products are designed and provided through the Company’s Noran Tel subsidiary located in Regina, Saskatchewan, Canada, which was acquired on January 2, 2007.
OSP Products. The Company’s OSP products provide service providers with products to transport, maintain and improve the reliability of services delivered over copper and fiber lines in the local access network.
Conference Plus, Inc. (“ConferencePlus” or “CP”), founded in 1988, is a full-service audio, web and video conferencing company that manages and hosts specific software and applications supporting its conferencing and meeting services. ConferencePlus is a
- 20 -
100% owned subsidiary of the Company and manages its conferencing and meeting services through its main operations center in Schaumburg, Illinois, and a facility in Dublin, Ireland. During December 2008, ConferencePlus became a wholly owned subsidiary when the Company purchased the remaining 8.5% minority interest.
ConferencePlus allows multiple individuals, organizations and/or businesses to conduct conference calls using a combination of audio, web and video collaboration and presentations. ConferencePlus offers conference call services that can include a blend of audio, graphics, spreadsheets and other documents that can be carried over and archived on the Internet to enhance the traditional audio conference call. By enabling the sharing of this blend of information, ConferencePlus can help organizations increase productivity and save money by reducing travel time, bringing down travel costs, and making it easier for people in remote locations to work together. Conferencing and meeting service technologies also allow organizations and individuals to collect and disseminate information faster, more accurately and without the associated costs of face-to-face meetings. These technologies also help companies communicate and collaborate effectively in the face of health and safety threats and other impediments to travel and formal gatherings.
The prices for the products within each market group vary based upon volume, customer specifications and other criteria, and are subject to change due to competition among telecommunications manufacturers and service providers. Increasing competition, in terms of the number of entrants and their size, and increasing scale of the Company’s customers because of past mergers, continues to exert downward pressure on prices for the Company’s products.
The Company’s customer base for its products is highly concentrated and comprised primarily of major U.S. telecommunications service providers (“telephone companies”), independent domestic local exchange carriers and public telephone administrations located outside the U.S. Due to the stringent quality specifications of its customers and the regulated environment in which its customers operate, the Company must undergo lengthy approval and procurement processes prior to selling its products. Accordingly, the Company must make significant up front investments in product and market development prior to actual commencement of sales of new products.
To remain competitive, the Company must continue to invest in new product development and invest in targeted sales and marketing efforts to launch new product lines. Failure to increase revenues from new products, whether due to lack of market acceptance, competition, technological change or otherwise, would have a material adverse effect on the Company’s business and results of operations. The Company expects to continue to evaluate new product opportunities and engage in extensive research and development activities.
The Company has expanded its product offerings in the CNS segment from basic high speed broadband to more sophisticated applications such as VoIP, in-premises networking, wireless/wireline convergence, IP Multimedia Subsystem (“IMS”) and FMC, and video / IPTV services. This will require the Company to continue to invest in research and development and sales and marketing, which could adversely affect short-term results of operations. In view of the Company’s current reliance on the telecommunications market for revenues and the unpredictability of orders and pricing pressures, the Company believes that period-to-period comparisons of its financial results are not necessarily meaningful and should not be relied upon as an indication of future performance.
In the CNS segment, the Company is focusing on the evolving broadband demand, which includes increased bandwidth, richer application sets and converged capabilities. The Company has introduced products for both the existing local telephone and fiber network including the UltraLine, ProLine, VersaLink, and UltraLine Series 3 which are targeted at the home networking, and small business markets. The Company expects to de-emphasize focus on the UltraLine Series 3 product to concentrate on more profitable initiatives. The Company is also focusing on cost reducing these products, adding new features and functionality to create additional value in these products.
The OSP segment has introduced products and services that focus on customer diversification and has changed from being a provider centered on service to Regional Bell Operating Companies into a provider with new sales channels including independent operating companies (“IOCs”), wireless service providers, MSOs, utility providers and OEMs worldwide. The Company acquired 100% of the common stock of Noran Tel, Inc. on January 2, 2007. With the addition of Noran Tel, the Company has obtained sales channels for some of its existing products, has added additional transmission products to offer in its existing sales channels and has gained new products in areas of power distribution and remote monitoring. The Company also plans to invest in new product areas to compliment wireless, fiber, and Ethernet applications.
- 21 -
In the first quarter of fiscal year 2009, the Company decided to cease the operations of its Westell Limited entity located in Basingstoke, England, to increase efforts to focus on the core businesses of the Company. All employees have been terminated and the facility has been closed. Westell Limited is shown as discontinued operations in the Company’s Consolidated Statements of Operations.
In fiscal year 2008, ConferencePlus was informed by its second largest customer that the customer intended to transfer all business to another conferencing provider. The transition by this customer occurred in the first fiscal quarter of 2009. The revenue from this customer was $0.3 million, $1.7 million and $10.3 million in fiscal years 2010, 2009 and 2008, respectively. The ConferencePlus segment has been impacted positively by the current economy as limited business travel increases conferencing call volume, but the lower overall employment market has negatively impacted the business.
The FCC determined that audio and video bridging services are equivalent to teleconferencing services and are “telecommunications” under the Telecommunications Act of 1996 and the Universal Service First Report and Order. Due to this FCC Ruling, ConferencePlus must pay FUSF on applicable revenue for services provided on or after October 1, 2008. The FCC allows telecommunications companies to recover the cost of collecting, remitting and reporting FUSF fees. ConferencePlus charges its clients an amount equal to what it must remit, plus charges an administrative fee to recover the cost of providing these services. ConferencePlus recorded approximately $2.0 million and $780,000 of revenue for FUSF related expenses, which are included in cost of telecom services, during the years ended March 31, 2010 and 2009, respectively.
Critical Accounting Policies
The Company uses estimates and judgments in applying its accounting policies that have a significant impact on the results reported in the Consolidated Financial Statements. The following are the Company’s most critical accounting policies.
Inventory Reserves
The Company reviews inventory for excess quantities and obsolescence based on its best estimates of future demand, product lifecycle status and product development plans. The Company uses historical information along with these future estimates to reserve for obsolete and potentially obsolete inventory. The Company also evaluates inventory valuation for lower of cost or market concerns. Prices related to future inventory demand are compared to current and committed inventory values.
Inventory Purchase Commitments
In the normal course of business, the Company enters into non-cancellable commitments for the purchase of inventory and long-distance telephone services. The commitments are at market rates. Should there be a significant decline in revenues the Company may absorb excess inventory and subsequent losses as a result of these commitments. The Company establishes reserves for potential losses on at-risk commitments.
Income Taxes
Deferred tax assets and liabilities are determined based on the difference between the financial statement and tax basis of assets and liabilities, applying enacted statutory tax rates in effect for the year in which the tax differences are expected to reverse. Deferred tax assets are reduced by a valuation allowance when, in the opinion of management, it is more likely than not that some portion or all of the deferred tax assets will not be realized. Deferred tax assets and liabilities are adjusted for the effects of changes in tax laws and rates on the date of enactment.
Goodwill and Intangibles
Pursuant to the requirements of FAS 142, Goodwill and Other Intangible Assets , as codified in ASC topic 350, Intangibles-Goodwill and Other (“ASC 350”), the Company evaluates its goodwill for impairment on an annual basis during the fourth quarter of each fiscal year or at an interim period if indicators of impairment exist. The goodwill impairment test compares the fair value of a reporting unit with its carrying value. If the carrying value of a reporting unit exceeds its fair value, goodwill of the reporting unit
- 22 -
would be considered impaired. To measure the amount of the impairment loss, the fair value of a reporting unit’s goodwill is compared to the carrying value of that goodwill. If the carrying value of a reporting unit’s goodwill exceeds the implied fair value of that goodwill, an impairment loss is recognized in an amount equal to that excess. The implied fair value of goodwill is determined in the same manner as the amount of goodwill recognized in a business combination is determined. The fair value of each of the Company’s reporting units was determined using a discounted cash flow methodology and current like-company market transactions. An impairment charge of approximately $9.7 million was taken in the fourth quarter of fiscal year 2008 at the Westell Inc. reporting unit in the combined equipment segments. In fiscal year 2009, a $1.4 million impairment was recorded at the Noran Tel reporting unit in the OSP segment. No impairment was found in fiscal year 2010.
On an ongoing basis, the Company reviews intangible assets and other long-lived assets other than goodwill for impairment whenever events and circumstances indicate that carrying values may not be recoverable. If such events or changes in circumstances occur, the Company will recognize an impairment loss if the fair value is less than the carrying value of the related asset. The impairment loss would adjust the asset to its fair value.
Revenue Recognition and Deferred Revenue
Revenue recognition on equipment where software is incidental to the product as a whole or where software is essential to the equipment’s functionality and falls under software accounting scope exceptions generally occurs when products are shipped, risk of loss has transferred to the customer, objective evidence exists that customer acceptance provisions have been met, no significant obligations remain, collection is reasonably assured and warranty can be estimated.
Where multiple element arrangements exist, fair value of each element is established using the relative selling price method, which requires the Company to use vendor-specific objective evidence (“VSOE”), reliable third-party objective evidence (“TPE”) or management’s best estimate of selling price, in that order.
The Company’s UltraLine Series3 products are sold primarily to a single customer with contractual provisions that include specified future software enhancements and post customer support (“PCS”) to maintain ongoing interoperability within the customer’s network. The Company was not able to establish VSOE or TPE for the specified future software enhancements and therefore relied on management’s estimates of fair value for each of the multiple elements in the arrangement. Deferred revenue is recorded for undelivered elements. See Note 3 to the Consolidated Financial Statements for a further description of revenue recognition relating to this product.
Stock–based Compensation
The Company accounts for stock-based compensation using the provisions of FAS 123 (revised 2004), Share-Based Payments, as codified in ASC topic 718, Compensation – Stock Compensation (“ASC 718”). ASC 718 requires the grant date fair value recognition of expense related to employee stock-based compensations awards over the requisite service period. Determining the fair value of equity-based options requires the Company to estimate the expected volatility of its stock, the risk-free interest rate, expected option term, expected dividend yield and expected forfeitures.
Warranty Costs
Most of the Company’s products carry a limited warranty ranging from one to three years for CNS segment products and up to seven years for OSP segment products. The warranty reserve is based on historical sales and cost of repair or replacement trends
New Accounting Pronouncements
In February 2010, the FASB issued ASU 2010-10, Consolidations (Topic 810): Amendments for Certain Investment Funds and in December 2009, the FASB issued ASU 2009-17, Consolidations (Topic 810): Improvements to Financial Reporting by Enterprises Involved with Variable Interest Entities. These ASU’s amend the FASB Accounting Standards Codification for Statement 167. (See FAS 167 effective date below.)
Effective April 1, 2010, the Company adopted FAS 167, Amendments to FASB interpretation 46(R). This Statement amends FIN 46(R), as codified in ASC 810, to require the Company to perform an analysis of existing investments to determine whether variable interest or interests give the Company a controlling financial interest in a VIE. This analysis identifies the primary beneficiary of a
- 23 -
VIE as the enterprise that has both the power to direct the activities of significant impact on a variable interest entity and the obligation to absorb losses or receive benefits from the VIE that could potentially be significant to the VIE. It also amends ASC 810 to require ongoing reassessments of whether an enterprise is the primary beneficiary of a variable interest entity. As a result of adoption, the Company is no longer considered the primary beneficiary of Contineo Systems, Inc. (“Contineo”), a variable interest entity for which the Company was considered the primary beneficiary and which required the financial performance of Contineo to be consolidated in the Company’s financial statements in fiscal years 2010, 2009 and 2008. Therefore, the Company will deconsolidate Contineo as of April 1, 2010. The deconsolidation of Contineo does not have a material impact on the Company’s financial statements.
Results of Operations
Fiscal Years Ended March 31, 2010, 2009 and 2008
| Revenue | Fiscal Year Ended March 31, | Increase (Decrease) | |||||||||||||||
| (in thousands) | 2010 | 2009 (a) | 2008 | 2010 vs. 2009 |
2009 vs. 2008 |
||||||||||||
| CNS equipment |
$ | 87,248 | $ | 84,207 | $ | 97,923 | $ | 3,041 | $ | (13,716 | ) | ||||||
| OSP equipment |
52,516 | 56,506 | 54,108 | (3,990 | ) | 2,398 | |||||||||||
| Combined equipment |
139,764 | 140,713 | 152,031 | (949 | ) | (11,318 | ) | ||||||||||
| ConferencePlus services |
41,721 | 45,203 | 53,698 | (3,482 | ) | (8,495 | ) | ||||||||||
| Consolidated revenue |
$ | 181,485 | $ | 185,916 | $ | 205,729 | $ | (4,431 | ) | $ | (19,813 | ) | |||||
| (a) | As adjusted, see Note 3 to the Consolidated Financial Statements. |
In fiscal year 2010, consolidated revenue decreased by 2%. CNS segment revenue increased by 4% and was due primarily to a 9% increase in unit volume offset in part by a 7% decrease in average sales price for the combined modem and gateway products. The ULS3 product revenue units decreased 6% with stable average selling prices between years. The 7% decrease in OSP revenue resulted from an overall weaker demand for network interface and mounting products. The 8% ConferencePlus revenue decrease was due to the weak economic environment and a loss of revenue from large customers offset in part by the addition of smaller customers which led to a decrease in call minutes. The decrease was offset in part by $1.2 million of additional revenue related to the collection of FUSF fees.
In fiscal year 2009, consolidated revenue decreased by 10%. CNS revenue decreased by 14%, OSP revenue increased 4% and ConferencePlus revenue decreased by 16%. The decrease in CNS revenue was due to a 26% decrease in unit volume of modems and gateway products along with a 20% decrease in average selling prices, which was partly offset by increased revenue from ULS3 product of $25.0 million. The OSP revenue increase was the result of increases in revenue from network interface units and outdoor mountings due to increased demand from wireline service providers for outside plant wireless backhaul solutions. The ConferencePlus revenue decrease was due to decreased call minutes related primarily to the loss of $8.6 million of revenue from its second largest customer in 2008. The decrease was offset in part by $780,000 of revenue related to the collection of FUSF fees.
- 24 -
| Gross profit and margin | Fiscal Year Ended March 31, | Increase (Decrease) | ||||||||||||||||||
| (in thousands) | 2010 | 2009 (a) | 2008 | 2010 vs. 2009 |
2009 vs. 2008 |
|||||||||||||||
| CNS |
$ | 14,348 | $ | 8,142 | NA | $ | 6,206 | NA | ||||||||||||
| 16.4 | % | 9.7 | % | NA | 6.7 | % | NA | |||||||||||||
| OSP |
23,042 | 22,808 | NA | 234 | NA | |||||||||||||||
| 43.9 | % | 40.4 | % | NA | 3.5 | % | NA | |||||||||||||
| Combined equipment |
37,390 | 30,950 | $ | 34,619 | 6,440 | $ | (3,669 | ) | ||||||||||||
| 26.8 | % | 22.0 | % | 22.8 | % | 4.8 | % | (0.8 | )% | |||||||||||
| ConferencePlus |
20,299 | 20,224 | 25,821 | 75 | (5,597 | ) | ||||||||||||||
| 48.7 | % | 44.7 | % | 48.1 | % | 4.0 | % | (3.4 | )% | |||||||||||
| Consolidated gross profit |
$ | 57,689 | $ | 51,174 | $ | 60,440 | $ | 6,515 | $ | (9,266 | ) | |||||||||
| Consolidated gross margin |
31.8 | % | 27.5 | % | 29.4 | % | 4.3 | % | (1.9 | )% | ||||||||||
| (a) | As adjusted, see Note 3 to the Consolidated Financial Statements. |
In fiscal year 2010, consolidated gross margin increased by 4.3% compared to fiscal year 2009. CNS gross margin increased 6.7% due primarily to a favorable mix of products sold and lower material costs that resulted from cost-reduced modem and gateway products along with lower freight costs of $1.1 million. Expedited freight was incurred in fiscal year 2009 relating primarily to the ULS3 product and did not recur in fiscal year 2010. OSP gross margin increased 3.5% due to product mix and lower freight costs of $372,000. ConferencePlus gross margin was negatively impacted in fiscal year 2009 by a loss contingency reserve of $700,000 for a contractual dispute. The ConferencePlus margin improvement to 48.7% in fiscal year 2010 resulted primarily from lower telecommunication costs caused by a change in the provider of those services and the absence of the $700,000 loss contingency reserve that was incurred in fiscal year 2009.
In fiscal year 2009, consolidated gross margin decreased by 1.9%. Gross margin in the combined equipment segment decreased by 0.8%. Sales of lower margin ULS3 product commenced in fiscal year 2009 in the CNS segment and OSP segment sales, which have a higher margin than CNS products, were a higher percentage of the combined equipment revenue. In fiscal year 2008, the Company recorded charges for excess and obsolete inventory in the amount of $2.4 million. Fiscal year 2008 also included period costs related to the shut down of the Aurora manufacturing facility including $1.2 million in accelerated depreciation expense. The decrease in gross margin percentage in fiscal year 2009 compared to fiscal 2008 at the ConferencePlus segment was due to lower revenue to cover fixed overhead costs and a $700,000 loss contingency reserve in fiscal year 2009 for a contractual dispute.
| Sales and marketing (“S&M”) | Fiscal Year Ended March 31, | Increase (Decrease) | ||||||||||||||||||
| (in thousands) | 2010 | 2009 (a) | 2008 | 2010 vs. 2009 |
2009 vs. 2008 |
|||||||||||||||
| CNS |
$ | 5,772 | $ | 9,464 | NA | $ | (3,692 | ) | NA | |||||||||||
| OSP |
4,998 | 5,468 | NA | (470 | ) | NA | ||||||||||||||
| Combined equipment |
10,770 | 14,932 | $ | 12,352 | (4,162 | ) | $ | 2,580 | ||||||||||||
| ConferencePlus |
7,217 | 9,221 | 11,715 | (2,004 | ) | (2,494 | ) | |||||||||||||
| Consolidated S&M expense |
$ | 17,987 | $ | 24,153 | $ | 24,067 | $ | (6,166 | ) | $ | 86 | |||||||||
| Percentage of Revenue |
10 | % | 13 | % | 12 | % | ||||||||||||||
| (a) | As adjusted, see Note 3 to the Consolidated Financial Statements. |
In fiscal year 2010, consolidated sales and marketing expense decreased 26% or $6.2 million compared to the prior year with reductions in all operating segments due primarily to reorganizations which resulted in less employees and related personnel costs. In the CNS and ConferencePlus segments, there were 15 and 16 fewer employees as of March 31, 2010 compared to March 31, 2009, respectively. The Company also placed cost controls in each division which resulted in lower spending across most expense categories.
In fiscal year 2009, sales and marketing expense increased in the combined equipment segments by $2.6 million due primarily to a $2.7 million net gain recorded during fiscal year 2008 related to the recovery of product warranty costs, third-party costs and internal costs for non-conforming products from a vendor supporting the CNS segment. Sales and marketing expenses decreased by $2.5 million in the ConferencePlus segment due primarily to reduction in the number of employees, causing lower personnel related expenses.
- 25 -
| Research and development (“R&D”) | Fiscal Year Ended March 31, | Increase (Decrease) | ||||||||||||||||||
| (in thousands) | 2010 | 2009 (a) | 2008 | 2010 vs. 2009 |
2009 vs. 2008 |
|||||||||||||||
| CNS |
$ | 9,024 | $ | 15,029 | NA | $ | (6,005 | ) | NA | |||||||||||
| OSP |
2,339 | 2,604 | NA | (265 | ) | NA | ||||||||||||||
| Combined equipment |
11,363 | 17,633 | $ | 19,946 | (6,270 | ) | $ | (2,313 | ) | |||||||||||
| ConferencePlus |
2,245 | 2,221 | 2,404 | 24 | (183 | ) | ||||||||||||||
| Consolidated R&D expense |
$ | 13,608 | $ | 19,854 | $ | 22,350 | $ | (6,246 | ) | $ | (2,496 | ) | ||||||||
| Percentage of Revenue |
7 | % | 11 | % | 11 | % | ||||||||||||||
| (a) | As adjusted, see Note 3 to the Consolidated Financial Statements. |
In fiscal year 2010, consolidated research and development expenses declined 31% or $6.2 million. The CNS segment made up the majority of this reduction with $6.0 million of lower expense resulting primarily from the reduction of 13 employees that caused $2.0 million of lower personnel-related expense. Additionally, CNS expense related to Contineo declined $808,000 and new product investments made in fiscal year 2009 for software and new markets did not continue in fiscal year 2010 and resulted in lower overall research and development spending.
In fiscal year 2009, research and development expense in the combined equipment segments decreased by $2.3 million due to a $4.5 million decrease in employee-related expense. Average headcount was reduced by 41% in the year and employee bonus payouts were earned at a lower rate than in the prior year. This decrease was offset by an increase in outside consulting expenses by $1.1 million due to moving some of the engineering development from internal employees to more cost-effective consultants in India.
| General and administrative (“G&A”) | Fiscal Year Ended March 31, | Increase (Decrease) | ||||||||||||||||||
| (in thousands) | 2010 | 2009 (a) | 2008 | 2010 vs. 2009 |
2009 vs. 2008 |
|||||||||||||||
| CNS |
$ | 3,244 | $ | 3,977 | NA | $ | (733 | ) | NA | |||||||||||
| OSP |
1,998 | 2,558 | NA | (560 | ) | NA | ||||||||||||||
| Unallocated corporate costs |
3,778 | 5,616 | NA | (1,838 | ) | NA | ||||||||||||||
| Combined equipment |
9,020 | 12,151 | $ | 13,722 | (3,131 | ) | $ | (1,571 | ) | |||||||||||
| ConferencePlus |
6,075 | 7,885 | 7,815 | (1,810 | ) | 70 | ||||||||||||||
| Consolidated G&A expense |
$ | 15,095 | $ | 20,036 | $ | 21,537 | $ | (4,941 | ) | $ | (1,501 | ) | ||||||||
| Percentage of Revenue |
8 | % | 11 | % | 10 | % | ||||||||||||||
| (a) | As adjusted, see Note 3 to the Consolidated Financial Statements. |
In fiscal year 2010, consolidated G&A expense decreased 25% or $4.9 million with the majority of the reduction in the ConferencePlus segment and in the unallocated corporate costs, which are shown in the combined equipment segments. The CNS and OSP segments share certain general and administrative resources. The CNS segment was allocated 65% of such shared resource costs and the OSP segment was allocated 35% of the shared costs. Fiscal year 2010 reductions in the shared CNS and OSP G&A expense compared to fiscal year 2009 resulted primarily from $473,000 of severance recorded in fiscal year 2009, lower information technology costs and lower bank fees resulting from a change in line of credit amounts and providers. ConferencePlus segment G&A decreased by 23% due primarily to lower stock-based compensation expense and lower personnel-related costs. The reduction in unallocated corporate costs resulted primarily from lower legal expenses of $1.1 million and $860,000 of non-recurring stock-based compensation expense relating to the accelerated vesting of restricted stock awards to Mr. Thomas Mader, a former Chief Executive Officer of the Company recorded in fiscal year 2009. These reductions were offset in part by a non-cash charge of $730,000 recorded in fiscal year 2010 to correct errors in stock-based compensation expense related to prior fiscal years. Legal expense in fiscal year 2009 included cost related to an SEC investigation, which concluded without enforcement action in fiscal year 2010.
- 26 -
In fiscal year 2009, the combined equipment segments general and administrative expense decreased $1.6 million. The decrease is primarily the result of $1.6 million in outside consulting expense incurred in fiscal year 2008 to assist the Company in implementing its outsourcing strategy. In addition, employee-related costs decreased $1.2 million, resulting from lower bonus expense in fiscal year 2009 and employee termination costs recorded in fiscal year 2008. The decreases were offset by $1.3 million of severance and stock-based compensation for the accelerated vesting of restricted stock awards to Mr. Thomas Mader, a former Chief Executive Officer noted above.
| Restructuring | Fiscal Year Ended March 31, | Increase (Decrease) | |||||||||||||||
| (in thousands) | 2010 | 2009 (a) | 2008 | 2010 vs. 2009 |
2009 vs. 2008 |
||||||||||||
| CNS |
$ | 414 | $ | 363 | NA | $ | 51 | NA | |||||||||
| OSP |
46 | 220 | NA | (174 | ) | NA | |||||||||||
| Combined equipment |
460 | 583 | $ | 5,717 | (123 | ) | $ | (5,134 | ) | ||||||||
| ConferencePlus |
149 | 169 | — | (20 | ) | 169 | |||||||||||
| Consolidated restructuring expense |
$ | 609 | $ | 752 | $ | 5,717 | $ | (143 | ) | $ | (4,965 | ) | |||||
| (a) | As adjusted, see Note 3 to the Consolidated Financial Statements. |
In fiscal years 2010 and 2009, the Company had cost reduction initiatives that led to reductions in force in all operating segments that resulted in severance cost for 50 and 20 employees, respectively. In fiscal year 2008, the Company moved substantially all of its manufacturing operations in the combined CNS and OSP segments from Aurora, Illinois, to offshore suppliers in Asia that resulted in the recognition of restructuring expenses related primarily to severance costs for 443 employees.
| Intangible amortization | Fiscal Year Ended March 31, | Increase (Decrease) | |||||||||||||||
| (in thousands) | 2010 | 2009 (a) | 2008 | 2010 vs. 2009 |
2009 vs. 2008 |
||||||||||||
| CNS |
$ | 1 | $ | — | $ | — | $ | 1 | $ | — | |||||||
| OSP |
528 | 1,823 | 1,834 | (1,295 | ) | (11 | ) | ||||||||||
| Combined equipment |
529 | 1,823 | 1,834 | (1,294 | ) | (11 | ) | ||||||||||
| ConferencePlus |
112 | 59 | — | 53 | 59 | ||||||||||||
| Consolidated intangible amortization |
$ | 641 | $ | 1,882 | $ | 1,834 | $ | (1,241 | ) | $ | 48 | ||||||
| (a) | As adjusted, see Note 3 to the Consolidated Financial Statements. |
Intangible assets consist primarily of product technology and customer relationships from previous acquisitions. The reduction in OSP intangible amortization in fiscal year 2010 compared to the two prior fiscal years was due to intangibles from the Teltrend, Inc. acquisition becoming fully amortized at the end of fiscal year 2009.
Goodwill impairment As of March 31, 2010, the Company had $1.1 million, $0.3 million and $0.8 million of goodwill in the ConferencePlus, ConferencePlus Global Services and Noran Tel reporting units, respectively. ConferencePlus and ConferencePlus Global Services are in the ConferencePlus operating segment while Noran Tel is part of the OSP operating segment.
The Company tests goodwill for impairment annually in its fiscal fourth quarter and on an interim basis if indicators of impairment are present. A two-step approach is used to test for goodwill impairment. The first step tests for impairment by comparing the fair value of each reporting unit to its carrying value, including goodwill. The second step, which is performed only if the fair value in step one is lower than the carrying value, measures the amount of impairment by comparing the implied fair value of goodwill to the carrying value of goodwill. The fair value of each reporting unit is estimated using a discounted cash flow methodology and current like-company market transactions. The key assumptions used to determine fair value include the weighted-average cost of capital as well as projections on revenue, costs and capital expenditures.
No impairment was identified during the fiscal year 2010 annual test. Due to the adverse economic environment, an interim test was performed on the Noran Tel reporting unit in the third quarter of fiscal year 2009 that resulted in a $1.4 million charge to adjust goodwill in the unit to its fair value. No impairment was identified in the annual test performed in the fourth quarter of fiscal year 2009. In conducting the annual impairment testing in fiscal year 2008, the Company determined that the goodwill recorded in the Westell Inc. reporting unit relating to the fiscal 2000 acquisition of Teltrend, Inc. and the fiscal 2006 acquisition of HyperEdge, Inc. was impaired, and as a result, a goodwill impairment charge of $9.7 million was recorded.
- 27 -
Other income (expense), net Other income (expense), net was $25,000, $662,000 and $3.7 million for fiscal years 2010, 2009, and 2008, respectively. Other income (expense), net was primarily comprised of interest income earned on short-term cash investments and unrealized gains or losses on intercompany balances denominated in foreign currency. The decrease in fiscal year 2010 compared to fiscal year 2009 was due primarily to lower short-term interest rates and greater holdings of cash in non-interest-bearing accounts, primarily in order to limit credit risk to principal. The decrease in fiscal year 2009 compared to fiscal year 2008 was due to lower cash balances and reduced short-term interest rates.
Income taxes Income tax in fiscal year 2010 was a $558,000 benefit compared to expense of $77,000 and $53.5 million for fiscal years 2009 and 2008, respectively. In fiscal year 2010, the Company recorded a $767,000 income tax benefit that was derived from a refund of alternative minimum tax credits. Additionally, the statute of limitations expired on a contingent tax reserve resulting in a $403,000 tax benefit. The remaining tax expense in fiscal year 2010 resulted from foreign, state and federal alternative minimum tax, as the Company was able to utilize its reserved federal net operating loss carryfowards to offset taxable income.
In assessing the realizability of the deferred tax assets, the Company considered whether it is more likely than not that some portion or all of the deferred tax assets will not be realized through the generation of future taxable income. As a result of this assessment, the Company recorded a valuation allowance to fully reserve for tax benefits generated in fiscal year 2008. In fiscal year 2009, the Company increased the valuation allowance to fully reserve for deferred tax assets recorded during the year and reduced it in fiscal year 2010 because the Company generated taxable income.
Minority interest Minority interest expense was $0, $74,000 and $260,000 in fiscal years 2010, 2009 and 2008, respectively. Minority interest expense represents the minority interest holder’s share of income for the then 91.5% owned subsidiary, Conference Plus, Inc. The remaining minority interest was purchased by the Company in the third quarter of fiscal year 2009, therefore no minority interest expense applied in fiscal year 2010.
Discontinued operations Net loss from discontinued operations was $0, $206,000 and $1.5 million in fiscal years 2010, 2009 and 2008, respectively. In the first quarter of fiscal year 2009, the Company decided to cease the operations of its Westell Limited subsidiary in the UK and closed the facility in the same year.
Net income (loss) Net income was $10.3 million in fiscal year 2010 compared to net losses of $16.6 million and $76.2 million in fiscal years 2009 and 2008, respectively. The changes were due to the reasons stated above.
Quarterly Results of Operations
The following tables present certain financial information for each of the last eight fiscal quarters. The Company believes that the unaudited information regarding each of these quarters is prepared on the same basis as the audited Consolidated Financial Statements of the Company appearing elsewhere in this Form 10-K. In the opinion of management, all necessary adjustments (consisting only of normal recurring adjustments) have been included to present fairly the unaudited quarterly results when read in conjunction with the audited Consolidated Financial Statements of the Company and the Notes thereto appearing elsewhere in this Form 10-K. These quarterly results of operations are not necessarily indicative of the results for any future period.
- 28 -
The quarterly fluctuations in revenue and gross profit are due primarily to fluctuations in the CNS segment. These fluctuations are due to product mix between the ULS3, modem and gateway products, quantity shipped and generally declining sales prices.
| Fiscal Year 2010 Quarter Ended | ||||||||||||||
| June 30, 2009 (a) | Sept. 30, 2009 | Dec. 31, 2009 | Mar. 31, 2010 | |||||||||||
| (in thousands, except per share amounts) | ||||||||||||||
| Revenue |
$ | 53,513 | $ | 47,353 | $ | 42,796 | $ | 37,823 | ||||||
| Gross profit |
15,207 | 14,572 | 13,771 | 14,139 | ||||||||||
| Operating expenses |
13,163 | 11,588 | 11,704 | 11,485 | ||||||||||
| Income tax |
(155 | ) | (75 | ) | 673 | 115 | ||||||||
| Net income (loss) |
1,978 | 2,887 | 2,736 | 2,726 | ||||||||||
| Net income (loss) per common share: |
||||||||||||||
| Basic |
$ | 0.03 | $ | 0.04 | $ | 0.04 | $ | 0.04 | ||||||
| Diluted |
$ | 0.03 | $ | 0.04 | $ | 0.04 | $ | 0.04 | ||||||
| (a) | As adjusted, see Note 3 to the Consolidated Financial Statements. |
Operating expenses in fiscal year 2010 included the following items: the June 30, 2009 quarter included $609,000 of restructuring costs, the December 31, 2009 quarter included a $730,000 non-cash charge to correct errors in stock-based compensation expense related to prior fiscal years and a $767,000 income tax benefit derived from a refund of alternative minimum tax credits.
| Fiscal Year 2009 Quarter Ended | ||||||||||||||||
| June 30, 2008 | Sept. 30, 2008 | Dec. 31,
2008 (a) |
Mar. 31,
2009 (a) |
|||||||||||||
| (in thousands, except per share amounts) | ||||||||||||||||
| Revenue |
$ | 38,058 | $ | 43,120 | $ | 48,755 | $ | 55,983 | ||||||||
| Gross profit |
12,847 | 13,110 | 12,372 | 12,845 | ||||||||||||
| Operating expenses |
18,009 | 18,405 | 16,475 | 15,169 | ||||||||||||
| Income tax |
(27 | ) | (48 | ) | 57 | (59 | ) | |||||||||
| Net income (loss) |
(5,521 | ) | (5,109 | ) | (4,022 | ) | (1,942 | ) | ||||||||
| Net income (loss) per common share: |
||||||||||||||||
| Basic |
$ | (0.08 | ) | $ | (0.07 | ) | $ | (0.06 | ) | $ | (0.03 | ) | ||||
| Diluted |
$ | (0.08 | ) | $ | (0.07 | ) | $ | (0.06 | ) | $ | (0.03 | ) | ||||
| (a) | As adjusted, see Note 3 to the Consolidated Financial Statements. |
Operating expenses in fiscal year 2009 included the following items: the September 30, 2008 quarter was impacted by $1.3 million of severance and stock-based compensation expense related to the accelerated vesting of restricted stock both for the former CEO, Thomas Mader; the December 31, 2008 quarter included $808,000 of restructuring expense and $1.4 million of goodwill impairment charges in the OSP segment; and in the quarter ended March 31, 2009, the Company recorded a $700,000 loss contingency for a contractual dispute as a component of cost of services in the ConferencePlus segment (in April 2010, a settlement agreement was reached for the $700,000) and a $925,000 non-cash rent charge to correct the Company’s lease accounting policy.
The Company may continue to experience significant fluctuations in quarterly results of operations. The Company believes that fluctuations in quarterly results may cause the market price of the Class A Common Stock to fluctuate, perhaps substantially. Some factors which have had an influence on and may continue to influence the Company’s results of operations in a particular quarter include, but are not limited to, the size and timing of customer orders and subsequent shipments, customer order deferrals in anticipation of new products, timing of product introductions or enhancements by the Company or its competitors, market acceptance of new products, technological changes in the telecommunications industry, competitive pricing pressures, accuracy of customer forecasts of end-user demand, write-offs for obsolete inventory, changes in the Company’s operating expenses, personnel changes, foreign currency fluctuations, changes in the mix of products sold, quality control of products sold, disruption in sources of supply, regulatory changes, capital spending, delays of payments by customers, working capital deficits and general economic conditions.
- 29 -
Sales to the Company’s customers typically involve long approval and procurement cycles and can involve large purchase commitments. Accordingly, cancellation or deferral of one or a small number of orders could cause significant fluctuations in the Company’s quarterly results of operations. As a result, the Company believes that period-to-period comparisons of its results of operations are not necessarily meaningful and should not be relied upon as indications of future performance.
Liquidity and Capital Resources
At March 31, 2010, the Company had $61.3 million in cash and cash equivalents, consisting of bank deposits and money market funds. At March 31, 2010, the Company had no amounts outstanding and $12.0 million available under its secured revolving credit facility.
The Company does not have any significant debt nor does it have material capital expenditure requirements, balloon payments or other payments due on long term obligations. The Company does not have any off-balance sheet arrangements other than the Enginuity note described in Note 12 of the Consolidated Financial Statements or standard operating leases. Total future obligations and commitments as of March 31, 2010 were $73.7 million. The Company believes that the existing sources of liquidity and cash from operations will satisfy cash flow requirements for the foreseeable future.
The Company entered into a Credit Agreement with The Private Bank and Trust Company dated as of March 5, 2009 (the “Credit Agreement”) and subsequently entered into a first amendment to its Credit Agreement to extend the maturity date to March 31, 2011. The Credit Agreement is an asset-based revolving credit facility in an amount up to $12.0 million based on 80% of eligible accounts receivable plus the lesser of 30% of eligible inventory or $3.0 million. The obligations of the Company under the Credit Agreement are secured by a guaranty from certain direct and indirect domestic subsidiaries of the Company, and by substantially all of the assets of the Company.
The revolving loans under the Credit Agreement bear interest at the greater of the London Interbank Offered Rate (“LIBOR”) plus a spread of 2.5%, or an alternative base rate. The alternative base rate is the greater of prime rate or the Federal Funds rate plus 0.25% (the “Base Rate”). The Company is also required to pay a non-use fee of 0.35% per annum on the unused portion of the revolving loans. These charges are waived if the Company maintains with the lender an average monthly demand deposit account balance of $5.0 million and an average monthly investment balance of $15.0 million. The Company maintained such balances in fiscal year 2010.
The Credit Agreement contains financial covenants that include a minimum EBITDA, a minimum tangible net worth and a limitation on capital expenditures for any fiscal year. The Company was in compliance with these covenants on March 31, 2010.
In addition, although the Company has never declared or paid any cash dividends on its common stock and does not anticipate paying any cash dividends in the foreseeable future, the Company’s credit facility restricts the Company’s ability to pay dividends without bank approval.
The Company’s operating activities generated cash of $17.5 million in fiscal year 2010 and used cash of $14.7 million and $1.9 million in fiscal years 2009 and 2008, respectively. Cash generated in fiscal year 2010 resulted primarily from net income, non-cash depreciation and amortization and non-cash stock-based compensation of $15.6 million plus changes in working capital. Cash used in fiscal year 2009 resulted primarily from a net loss of $16.6 million offset by $10.4 million of depreciation, amortization, stock-based compensation, restructuring and goodwill impairment. The change in balance sheet accounts was a use of $8.7 million resulting primarily from increases in inventory, prepaid expenses and accounts receivable. Cash used in fiscal 2008 resulted primarily from a net loss of $76.2 million, which includes $53.6 million valuation allowance on deferred taxes and $9.7 million of non-cash goodwill impairment. Deprecation, amortization, stock-based compensation and restructuring offset the loss by $15.3 million.
The Company’s investing activities used $948,000, $3.3 million and $3.1 million in fiscal years 2010, 2009 and 2008, respectively. In fiscal year 2010, the Company used $923,000 on capital expenditures primarily in its ConferencePlus segment for bridging equipment. In fiscal year 2009, the Company used $2.2 million on capital expenditures and $3.7 million to acquire the remaining minority interest of Conference Plus, Inc. Additionally, the Company sold $2.6 million of short-term investments to fund a deferred
- 30 -
compensation arrangement. In fiscal year 2008, the Company used $4.7 million on capital expenditures and received $2.3 million from the sale of manufacturing equipment no longer required after production moved offshore. The combined equipment segments capital expenditures were $1.3 million in fiscal year 2009, which were primarily for leasehold improvements and storage racking to convert the former manufacturing facility into a distribution facility. The combined equipment segments capital expenditures for fiscal year 2008 were $2.1 million and were primarily for machinery and research and development equipment purchases. The ConferencePlus segment capital expenditures in fiscal year 2009 and 2008 were $0.9 million and $2.6 million, respectively. These expenditures were primarily for teleconference bridge equipment.
The Company’s financing activities used cash of $1.5 million and $1.4 million in fiscal year 2010 and 2009, respectively and generated $316,000 of cash in fiscal year 2008. The Company purchased $1.4 million and $1.6 million of treasury stock in fiscal year 2010 and 2009, respectively. The primary financing source of cash in fiscal year 2008 was proceeds from the issuance of stock for the exercise of stock options.
Future obligations and commitments as of March 31, 2010 consisted of the following:
| Payments due by fiscal year | |||||||||||||||||||||
| (in thousands) | 2011 | 2012 | 2013 | 2014 | 2015 | Thereafter | Total | ||||||||||||||
| Purchase obligations* |
$ | 54,788 | $ | 82 | $ | 5 | $ | — | $ | — | $ | — | $ | 54,875 | |||||||
| Future minimum lease payments for operating leases |
3,057 | 2,763 | 2,643 | 2,296 | 2,135 | 5,936 | 18,830 | ||||||||||||||
| Future obligations and commitments |
$ | 57,845 | $ | 2,845 | $ | 2,648 | $ | 2,296 | $ | 2,135 | $ | 5,936 | $ | 73,705 | |||||||
| * | Purchase obligations consist of raw materials in the CNS and OSP equipment segments and local and long distance telephone service commitments in the ConferencePlus segment that arise in the normal course of business operations. |
As of March 31, 2010, the Company had deferred tax assets of approximately $66.0 million before a valuation allowance of $60.3 million, which reduced the recorded net deferred tax asset to $5.7 million. The remaining deferred tax asset is fully reserved by a FIN 48 liability recorded in other long-term liabilities.
The net operating loss carryforwards begin to expire in 2020. Realization of deferred tax assets associated with the Company’s future deductible temporary differences, net operating loss carryforwards and tax credit carryforwards is dependent upon generating sufficient taxable income prior to their expiration, among other factors. The Company uses estimates of future taxable income to access the valuation allowance required against deferred tax assets. Management periodically evaluates the recoverability of the deferred tax assets and will adjust the valuation allowance against deferred tax assets accordingly.
Off-Balance Sheet Arrangements
In fiscal year 2005, the Company sold its Data Station Termination product lines and specified fixed assets to Enginuity Communications Corporation (“Enginuity”). The Company provided an unconditional guarantee relating to a 10-year term note payable by Enginuity to a third-party lender that financed the transaction (the “Enginuity Note”). The Enginuity Note had an unpaid balance of $854,000 as of March 31, 2010. Certain owners of Enginuity personally guaranteed the note and pledged assets as collateral. These personal guarantees will stay in place until the note is paid in full, as will the Company’s. Under the Company’s guarantee, the Company must pay all amounts due under the note payable upon demand from the lender, however, the Company would have recourse against the assets of Enginuity, the personal guarantees, and pledged assets.
The Company evaluated ASC 810 and concluded that Enginuity is a VIE as a result of the debt guarantee. The Company is not considered the primary beneficiary of the VIE and consolidation therefore has not been and is not required.
- 31 -
At the time of the product sale, the Company assessed its obligation under this guarantee pursuant to the provisions of FIN 45, Guarantor’s Accounting and Disclosure Requirements for Guarantees, Including Indirect Guarantees of Indebtedness of Others, as codified in ASC topic 460, Guarantees (“ASC 460”), and recorded a $300,000 liability for the value of the guarantee. The balance of the guarantee liability was $100,000 as of March 31, 2010.
- 32 -
| ITEM 7A. | QUANTITATIVE AND QUALITATIVE DISCLOSURES ABOUT MARKET RISK |
The Company is subject to certain market risks, including foreign currency rate exposures. The Company has foreign subsidiaries in Ireland and Canada that develop and sell products and services in those respective countries and in other countries. The Company is exposed to potential gains and losses from foreign currency fluctuations affecting net investments and earnings denominated in foreign currencies. The Company’s primary future exposure is to changes in exchange rates for the U.S. dollar versus the Euro and Canadian dollar. Approximately 7% of the Company fiscal year 2010 revenue was denominated in foreign currencies. The Company estimates market risk as the potential decrease in pretax earnings resulting from a hypothetical decrease in the ending exchange rate of 10%. If such a decrease occurred, the Company would incur approximately $46,000 in additional other expense based on the ending intercompany balance outstanding at March 31, 2010.
As of March 31, 2010, the balance in the cumulative foreign currency translation adjustment account, which is a component of stockholders’ equity, was an unrealized gain of $645,000.
| ITEM 8. | FINANCIAL STATEMENTS AND SUPPLEMENTARY DATA |
The Company’s Consolidated Financial Statements required by Item 8, together with the reports thereon of the Independent Registered Public Accounting Firm are set forth on pages 41 - 73 of this report and are incorporated by reference in this Item 8. The Consolidated Financial Statement schedule listed under Item 15(a)2, is set forth on page 74 of this report and is incorporated by referenced in this Item 8 and should be read in conjunction with the financial statements.
| ITEM 9. | CHANGES IN AND DISAGREEMENTS WITH ACCOUNTANTS ON ACCOUNTING AND FINANCIAL DISCLOSURE |
None.
| ITEM 9A. | CONTROLS AND PROCEDURES |
Evaluation of Disclosure Controls and Procedures
Under the supervision and with the participation of the Company’s senior management, including the Company’s Chief Executive Officer and Chief Financial Officer, the Company conducted an evaluation of the effectiveness of the design and operation of the Company’s disclosure controls and procedures, as defined in Rules 13a-15(e) and 15d-15(e) under the Securities Exchange Act of 1934, as amended (the “Exchange Act”), as of the end of the period covered by this annual report (the “Evaluation Date”). Based on this evaluation, the Company’s Chief Executive Officer and Chief Financial Officer concluded as of the Evaluation Date that the Company’s disclosure controls and procedures were effective such that the information relating to the Company, including consolidated subsidiaries, required to be disclosed in the Company’s Securities and Exchange Commission (“SEC”) reports (i) is recorded, processed, summarized and reported within the time periods specified in SEC rules and forms, and (ii) is accumulated and communicated to the Company’s management, including the Company’s Chief Executive Officer and Chief Financial Officer, as appropriate to allow timely decisions regarding required disclosure.
Management’s Report on Internal Control Over Financial Reporting
Management is responsible for establishing and maintaining adequate internal control over financial reporting. Management assessed the effectiveness of the Company’s internal control over financial reporting as of March 31, 2010 using criteria established in Internal Control-Integrated Framework issued by the Committee of Sponsoring Organizations of the Treadway Commission (“COSO”) and concluded that the Company maintained effective internal control over financial reporting as of March 31, 2010.
Because of its inherent limitations, although designed and operated to provide reasonable assurance that the objectives of the control system are met, internal control over financial reporting may not prevent or detect misstatements. Also, projections of any evaluation of effectiveness to future periods are subject to risk that controls may become inadequate because of changes in conditions, or that the degree of compliance with the policies may deteriorate.
- 33 -
The Company’s Independent Registered Public Accounting Firm has issued an audit report on its assessment of the Company’s internal control over financial reporting as of March 31, 2010. This report is included on page 42.
Changes in Internal Control Over Financial Reporting
There have been no changes in the Company’s internal control over financial reporting that occurred during the three months ended March 31, 2010 that have materially affected or are reasonably likely to materially affect the Company’s internal control over financial reporting.
The Company did supplement the quarterly procedures to test third-party software reports to ensure accurate and complete stock-based compensation expense. The Company intends to implement a new third-party stock-based compensation software solution.
| ITEM 9B. | OTHER INFORMATION |
None.
- 34 -
PART III
| ITEM 10. | DIRECTORS, EXECUTIVE OFFICERS AND CORPORATE GOVERNANCE |
(a) Directors of the Company
The information required by this Item is set forth in the Company’s Proxy Statement for the Annual Meeting of Stockholders to be held in September 2010 under the captions “Election of Directors”, “Corporate Governance – Board Committees” and “Section 16(a). Beneficial Ownership Reporting Compliance” which information is incorporated herein by reference.
(b) Executive Officers of the Company
The information required by this Item is set forth in the Company’s Proxy Statement for the Annual Meeting of Stockholders to be held in September 2010 under the caption “Corporate Governance - Executive Officers,” which information is incorporated herein by reference.
CODE OF BUSINESS CONDUCT
We have adopted a Code of Business Conduct within the meaning of Item 406(b) of Regulation S-K. This Code of Business Conduct applies to all of our directors, officers (including the principal executive officer, principal financial officer, principal accounting officer and any person performing similar functions) and employees. This Code of Business Conduct is publicly available in the corporate governance section on our website at http://www.westell.com. The Company intends to satisfy the disclosure requirement under Item 5.05 of Form 8-K by posting on its website any amendments to, or waivers from, its Code of Business Conduct applicable to our principal executive officer, principal financial officer, principal accounting officer and any person performing similar functions. Copies of the Code of Business Conduct will be provided free of charge upon written request directed to the Secretary of the Company at the address of the principal executive offices.
| ITEM 11. | EXECUTIVE COMPENSATION |
The information required by this Item is set forth in the Company’s Proxy Statement for the Annual Meeting of Stockholders to be held in September 2010 under the captions “Compensation Discussion and Analysis”, “Compensation Committee Interlocks and Insider Participation”, “Compensation Committee Report on Executive Compensation”, “Summary Compensation Table”, “Grants of Plan-Based Awards”, “Outstanding Equity Awards at Fiscal Year-End”, “Option Exercises and Stock Vested”, “Potential Payments Upon Termination or Change in Control” and “Director Compensation”, which information is incorporated herein by reference.
| ITEM 12. | SECURITY OWNERSHIP OF CERTAIN BENEFICIAL OWNERS AND MANAGEMENT AND RELATED STOCKHOLDER MATTERS |
The information required by this Item is set forth in the Company’s Proxy Statement for the Annual Meeting of Stockholders to be held in September 2010 under the captions “Ownership of the Capital Stock of the Company,” and “Equity Compensation Plan Information” which information is incorporated herein by reference.
| ITEM 13. | CERTAIN RELATIONSHIPS AND RELATED TRANSACTIONS, AND DIRECTOR INDEPENDENCE |
The information required by this Item is set forth in the Company’s Proxy Statement for the Annual Meeting of Stockholders to be held in September 2010 under the caption “Certain Relationships and Related Party Transactions,” which information is incorporated herein by reference.
| ITEM 14. | PRINCIPAL ACCOUNTANT FEES AND SERVICES |
The information required by this item is incorporated herein by reference to the sections entitled “Fees to the Company’s Auditors” and “Approval of Services Provided by Independent Registered Public Accounting Firm” in the Company’s Proxy Statement for the Annual Meeting of Stockholders to be held in September 2010.
- 35 -
PART IV
| ITEM 15. | EXHIBITS AND FINANCIAL STATEMENT SCHEDULE |
(a)(1) Financial Statements
The following documents are filed as part of this report:
The Consolidated Financial Statements of Westell Technologies, Inc. at March 31, 2010 and 2009 and for each of the three fiscal years in the period ended March 31, 2010, together with the Report of Independent Registered Public Accounting Firm, are set forth on pages 41 through 73 of this Report.
The supplemental financial information listed and appearing hereafter should be read in conjunction with the Consolidated Financial Statements included in the report.
(2) Financial Statement Schedule
The following are included in Part IV of this Report for each of the years ended March 31, 2010, 2009 and 2008 as applicable:
Schedule II - Valuation and Qualifying Accounts - page 74
Financial statement schedules not included in this report have been omitted either because they are not applicable or because the required information is shown in the Consolidated Financial Statements or notes thereto, included in this report.
(3) Exhibits
| Exhibit |
Document Description | |
| 3.1 | Amended and Restated Certificate of Incorporation, as amended (incorporated herein by reference to Exhibit 3.1 to the Company’s Quarterly Report on Form 10-Q for the quarter ended June 30, 2005). | |
| 3.2 | Amended and Restated By-laws (incorporated herein by reference to Exhibit 3.1 to the Company’s Form 8-K filed on December 18, 2009). | |
| 9.1 | Voting Trust Agreement dated February 23, 1994, as amended (incorporated herein by reference to Exhibit 9.1 to the Company’s Registration Statement on Form S-1, as amended, Registration No. 33-98024). | |
| 10.1(a) | Credit Agreement, dated as of March 5, 2009, among Westell Technologies, Inc., Westell, Inc., Teltrend LLC and Conference Plus, Inc., as borrowers, and The Private Bank and Trust Company, as lender (incorporated herein by reference to Exhibit 10.37 to the Company’s Annual Report on Form 10-K for the year ended March 31, 2009). | |
| 10.1(b) | First Amendment, dated as of March 5, 2010, to Credit Agreement dated as of March 5, 2009, by and among Westell Technologies, Inc., Westell, Inc., Teltrend LLC, Conference Plus, Inc. and The Private Bank and Trust Company (incorporated herein by reference to Exhibit 10.1 to the Company’s Form 8-K filed on March 8, 2010). | |
| 10.1(c) | Guaranty and Security Agreement, dated as of March 5, 2009, among Westell Technologies, Inc., Westell, Inc., Teltrend LLC, Conference Plus, Inc. and the other parties thereto, as guarantors and grantors, in favor of The Private Bank and Trust Company (incorporated herein by reference to Exhibit 10.38 to the Company’s Annual Report on Form 10-K for the year ended March 31, 2009). | |
| 10.2 | Stock Transfer Restriction Agreement entered into by members of the Penny family, as amended, (incorporated herein by reference to Exhibits 10.4 and 10.16 to the Company’s Registration Statement on Form S-1, as amended, Registration No. 33-98024). | |
| 10.3 | Form of Registration Rights Agreement among Westell Technologies, Inc. and Robert C. Penny III and Melvin J. Simon, as trustees of the Voting Trust dated February 23, 1994 (incorporated herein by reference to Exhibit 10.5 to the Company’s Registration Statement on Form S-1, as amended, Registration No. 33-98024). | |
- 36 -
| *10.4 | 1995 Stock Incentive Plan (incorporated herein by reference to Exhibit 10.6 to the Company’s Registration Statement on Form S-1, as amended, Registration No. 33-98024). | |
| *10.5 | Employee Stock Purchase Plan (as amended) (incorporated herein by reference to the exhibit filed with the Company’s Proxy Statement for the 2008 Annual Meeting of Stockholders filed on July 29, 2008). | |
| 10.6 | Lease dated September 29, 1997 between Westell Technologies, Inc. and Westell, Inc. (incorporated herein by reference to Exhibit 99.3 to the Company’s Form 8-K filed on October 2, 1997). | |
| 10.7 | Settlement Agreement dated November 30, 2002 with respect to the lease dated September 29, 1997 (incorporated herein by reference to Exhibit 10.12 to the Company’s Annual Report on Form 10-K for the year ended March 31, 2008). | |
| *10.8 | Consulting Agreement by and between Westell Technologies, Inc. and E. Van Cullens (incorporated by reference to Exhibit 99.1 to the Company’s Current Report on Form 8-K filed on January 26, 2007). | |
| *10.9 | Westell Technologies, Inc. 2004 Stock Incentive Plan (incorporated herein by reference to Exhibit B to the Company’s Proxy Statement for the 2004 Annual Meeting of Stockholders filed on July 29, 2004). | |
| *10.10 | Form of Restricted Stock Unit Award under the Westell Technologies, Inc. 2004 Stock Incentive Plan. | |
| *10.11 | Form of Stock Option Award under the Westell Technologies, Inc. 2004 Stock Incentive Plan (incorporated herein by reference to Exhibit 10.4 to the Company’s Quarterly Report on Form 10-Q for the quarter ended December 31, 2008). | |
| *10.12 | Conference Plus, Inc. 2002 Nonqualified Stock Plan (incorporated herein by reference to Exhibit 10.2 to the Company’s Quarterly Report on Form 10-Q for the quarter ended December 31, 2007). | |
| *10.13 | Form of Conference Plus, Inc. Nonqualified Stock Option Award (for Management Level Employees) (incorporated herein by reference to Exhibit 10.3 to the Company’s Quarterly Report on Form 10-Q for the quarter ended December 31, 2007). | |
| *10.14 | Form of Conference Plus, Inc. Nonqualified Stock Option Award (for Non-Management Level Employees) (incorporated herein by reference to Exhibit 10.4 to the Company’s Quarterly Report on Form 10-Q for the quarter ended December 31, 2007). | |
| *10.15 | Employment Agreement by and among Westell Technologies, Inc., Westell, Inc. and Richard S. Gilbert (incorporated herein by reference to Exhibit 10.1 to the Company’s Form 8-K filed on January 23, 2009). | |
| *10.16 | Employment Agreement dated April 14, 2009 by and between Westell Technologies, Inc., Westell, Inc. and Brian S. Cooper (incorporated herein by reference to Exhibit 10.1 to the Company’s Form 8-K filed on April 17, 2009). | |
| *10.17 | Severance Agreement dated April 15, 2009 by and between Westell Technologies, Inc., Westell, Inc. and Amy T. Forster (incorporated herein by reference to Exhibit 10.2 to the Company’s Form 8-K filed on April 17, 2009). | |
| *10.18 | Form of Consolidated Annual Bonus Plan | |
| *10.19 | Summary of Director Compensation. | |
| *10.20 | Form of Non-Employee Director Restricted Stock Award under the 2004 Stock Incentive Plan for awards granted prior to April 2010. | |
| *10.21 | Form of Non-Employee Director Restricted Stock Award under the 2004 Stock Incentive Plan for awards granted in April 2010. | |
| *10.22 | Form of Incentive Stock Option Award under the 2004 Stock Incentive Plan. | |
| 21.1 | Subsidiaries of the Registrant. | |
| 23.1 | Consent of Ernst & Young LLP. | |
| 31.1 | Certification of the Chief Executive Officer pursuant to Section 302 of Sarbanes-Oxley Act of 2002. | |
| 31.2 | Certification of the Chief Financial Officer pursuant to Section 302 of Sarbanes-Oxley Act of 2002. | |
| 32.1 | Certification of the Chief Executive Officer and Chief Financial Officer pursuant to Section 906 of Sarbanes-Oxley Act of 2002. | |
| * | Management contract or compensatory plan or arrangement. |
- 37 -
(b) Exhibits
The exhibits filed as part of this Annual Report on Form 10-K are as specified in Item 15(a)(3) herein.
(c) Financial Statement Schedule
The financial statement schedule filed as part of this Annual Report on Form 10-K are as specified in Item 15(a)(2) herein.
- 38 -
Pursuant to the requirements of Section 13 or 15(d) of the Securities Exchange Act of 1934, the registrant has duly caused this report to be signed on its behalf by the undersigned, thereunto duly authorized on May 27, 2010.
| WESTELL TECHNOLOGIES, INC. | ||
| By | /S/ RICHARD S. GILBERT | |
| Richard S. Gilbert | ||
| President and Chief Executive Officer | ||
Pursuant to the requirements of the Securities Exchange Act of 1934, this report has been signed below by the following persons on behalf of the registrant and in the capacities indicated on May 27, 2010.
| Signature |
Title | |||
| /S/ RICHARD S. GILBERT | President, Chief Executive Officer and Chairman of the Board (Principal Executive Officer) | |||
| Richard S. Gilbert | ||||
| /S/ BRIAN S. COOPER | Chief Financial Officer, Treasurer and Secretary (Principal Financial Officer) | |||
| Brian S. Cooper | ||||
| /S/ AMY T. FORSTER | Chief Accounting Officer (Principal Accounting Officer) | |||
| Amy T. Forster | ||||
| /S/ ROBERT W. FOSKETT | Director | |||
| Robert W. Foskett | ||||
| /S/ JAMES M. FROISLAND | Director | |||
| James M. Froisland | ||||
| /S/ DENNIS O. HARRIS | Director | |||
| Dennis O. Harris | ||||
| /S/ MARTIN HERNANDEZ | Director | |||
| Martin Hernandez | ||||
| /S/ EILEEN A. KAMERICK | Director | |||
| Eileen A. Kamerick | ||||
| /S/ ROBERT C. PENNY III | Director | |||
| Robert C. Penny III | ||||
| /S/ MARTIN H. SINGER | Director | |||
| Martin H. Singer | ||||
- 39 -
INDEX TO CONSOLIDATED FINANCIAL STATEMENTS
AND SUPPLEMENTARY DATA
| Page | ||
| Item |
||
| Consolidated Financial Statements: |
||
| 41 | ||
| Report of Independent Registered Public Accounting Firm on Internal Control Over Financial Reporting |
42 | |
| 43 | ||
| Consolidated Statements of Operations for the years ended March 31, 2010, 2009 and 2008 |
44 | |
| 45 | ||
| Consolidated Statements of Cash Flows for the years ended March 31, 2010, 2009 and 2008 |
46 | |
| 47 | ||
| Financial Statement Schedule: |
||
| 74 | ||
- 40 -
Report of Independent Registered Public Accounting Firm
To the Board of Directors and Stockholders of Westell Technologies, Inc.
We have audited the accompanying consolidated balance sheets of Westell Technologies, Inc. and Subsidiaries (the “Company”) as of March 31, 2010 and 2009, and the related consolidated statements of operations, stockholders’ equity and comprehensive income (loss), and cash flows for each of the three years in the period ended March 31, 2010. Our audit also included the financial statement schedule listed in the Index at Item 15a(2). These financial statements and schedule are the responsibility of the Company’s management. Our responsibility is to express an opinion on these financial statements and schedule based on our audits.
We conducted our audits in accordance with the standards of the Public Company Accounting Oversight Board (United States). Those standards require that we plan and perform the audit to obtain reasonable assurance about whether the financial statements are free of material misstatement. An audit includes examining, on a test basis, evidence supporting the amounts and disclosures in the financial statements. An audit also includes assessing the accounting principles used and significant estimates made by management, as well as evaluating the overall financial statement presentation. We believe that our audits provide a reasonable basis for our opinion.
In our opinion, the financial statements referred to above present fairly, in all material respects, the consolidated financial position of Westell Technologies, Inc. and subsidiaries at March 31, 2010 and 2009, and the consolidated results of their operations and their cash flows for each of the three years in the period ended March 31, 2010, in conformity with U.S. generally accepted accounting principles. Also, in our opinion, the related financial statement schedule, when considered in relation to the basic financial statements taken as a whole, presents fairly, in all material respects, the information set forth therein.
As discussed in Note 3 of the Notes to the Consolidated Financial Statements, the Company has retrospectively adopted the Financial Accounting Standards Board’s amended accounting standards related to revenue recognition for arrangements with multiple deliverables and arrangements that include software elements.
We also have audited, in accordance with the standards of the Public Company Accounting Oversight Board (United States), Westell Technologies, Inc. and Subsidiaries’ internal control over financial reporting as of March 31, 2010, based on criteria established in Internal Control-Integrated Framework issued by the Committee of Sponsoring Organizations of the Treadway Commission and our report dated May 27, 2010 expressed an unqualified opinion thereon.
/s/ Ernst & Young LLP
Chicago, Illinois
May 27, 2010
- 41 -
Report of Independent Registered Public Accounting Firm
The Board of Directors and Stockholders of Westell Technologies, Inc.
We have audited Westell Technologies, Inc. and Subsidiaries’ internal control over financial reporting as of March 31, 2010, based on criteria established in Internal Control—Integrated Framework issued by the Committee of Sponsoring Organizations of the Treadway Commission (the COSO criteria). Westell Technologies, Inc. and Subsidiaries’ management is responsible for maintaining effective internal control over financial reporting, and for its assessment of the effectiveness of internal control over financial reporting included in the accompanying Management’s Report on Internal Control Over Financial Reporting. Our responsibility is to express an opinion on the company’s internal control over financial reporting based on our audit.
We conducted our audit in accordance with the standards of the Public Company Accounting Oversight Board (United States). Those standards require that we plan and perform the audit to obtain reasonable assurance about whether effective internal control over financial reporting was maintained in all material respects. Our audit included obtaining an understanding of internal control over financial reporting, assessing the risk that a material weakness exists, testing and evaluating the design and operating effectiveness of internal control based on the assessed risk, and performing such other procedures as we considered necessary in the circumstances. We believe that our audit provides a reasonable basis for our opinion.
A company’s internal control over financial reporting is a process designed to provide reasonable assurance regarding the reliability of financial reporting and the preparation of financial statements for external purposes in accordance with generally accepted accounting principles. A company’s internal control over financial reporting includes those policies and procedures that (1) pertain to the maintenance of records that, in reasonable detail, accurately and fairly reflect the transactions and dispositions of the assets of the company; (2) provide reasonable assurance that transactions are recorded as necessary to permit preparation of financial statements in accordance with generally accepted accounting principles, and that receipts and expenditures of the company are being made only in accordance with authorizations of management and directors of the company; and (3) provide reasonable assurance regarding prevention or timely detection of unauthorized acquisition, use, or disposition of the company’s assets that could have a material effect on the financial statements.
Because of its inherent limitations, internal control over financial reporting may not prevent or detect misstatements. Also, projections of any evaluation of effectiveness to future periods are subject to the risk that controls may become inadequate because of changes in conditions, or that the degree of compliance with the policies or procedures may deteriorate.
In our opinion, Westell Technologies, Inc. maintained, in all material respects, effective internal control over financial reporting as of March 31, 2010, based on the COSO criteria.
We also have audited, in accordance with the standards of the Public Company Accounting Oversight Board (United States), the consolidated balance sheets of Westell Technologies, Inc. and Subsidiaries as of March 31, 2010 and 2009, and the related consolidated statements of operations, stockholders’ equity and comprehensive income (loss), and cash flows for each of the three years in the period ended March 31, 2010 of Westell Technologies, Inc. and Subsidiaries and our report dated May 27, 2010 expressed an unqualified opinion thereon.
/s/ Ernst & Young LLP
Chicago, Illinois
May 27, 2010
- 42 -
WESTELL TECHNOLOGIES, INC. AND SUBSIDIARIES
CONSOLIDATED BALANCE SHEETS
(In thousands, except share amounts)
| March 31, 2010 | March 31, 2009 | |||||||
| As adjusted (See Note 3) |
||||||||
| Assets |
||||||||
| Current assets: |
||||||||
| Cash and cash equivalents |
$ | 61,315 | $ | 46,058 | ||||
| Accounts receivable (net of allowance of $ 237 and $ 289, respectively) |
17,683 | 20,827 | ||||||
| Inventories |
21,258 | 20,178 | ||||||
| Prepaid expenses and other current assets |
4,276 | 7,487 | ||||||
| Total current assets |
104,532 | 94,550 | ||||||
| Property and equipment: |
||||||||
| Machinery and equipment |
15,681 | 15,920 | ||||||
| Office, computer and research equipment |
12,855 | 18,580 | ||||||
| Leasehold improvements |
9,313 | 9,342 | ||||||
| 37,849 | 43,842 | |||||||
| Less accumulated depreciation and amortization |
(33,184 | ) | (36,947 | ) | ||||
| Property and equipment, net |
4,665 | 6,895 | ||||||
| Goodwill |
2,162 | 2,009 | ||||||
| Intangibles, net |
4,063 | 4,333 | ||||||
| Deferred income taxes and other assets |
6,412 | 7,777 | ||||||
| Total assets |
$ | 121,834 | $ | 115,564 | ||||
| Liabilities and Stockholders’ Equity |
||||||||
| Current liabilities: |
||||||||
| Accounts payable |
$ | 15,195 | $ | 17,883 | ||||
| Accrued expenses |
4,781 | 5,822 | ||||||
| Accrued compensation |
4,422 | 3,667 | ||||||
| Deferred revenue |
860 | 2,119 | ||||||
| Total current liabilities |
25,258 | 29,491 | ||||||
| Deferred revenue long-term |
174 | 546 | ||||||
| Other long-term liabilities |
8,671 | 9,079 | ||||||
| Total liabilities |
34,103 | 39,116 | ||||||
| Commitments and contingencies (Notes 1 and 7) |
||||||||
| Stockholders’ equity: |
||||||||
| Class A common stock, par $0.01, Authorized – 109,000,000 shares Issued and outstanding – 52,762,326 and 53,862,409 shares at March 31, 2010 and 2009, respectively |
528 | 539 | ||||||
| Class B common stock, par $0.01, Authorized – 25,000,000 shares Issued and outstanding – 14,693,619 shares at March 31, 2010 and 2009 |
147 | 147 | ||||||
| Preferred stock, par $0.01, Authorized – 1,000,000 shares Issued and outstanding – none |
— | — | ||||||
| Additional paid-in capital |
398,756 | 397,242 | ||||||
| Treasury stock at cost – 4,273,309 and 3,020,448 shares at March 31, 2010 and 2009, respectively |
(3,302 | ) | (1,904 | ) | ||||
| Cumulative translation adjustment |
645 | (206 | ) | |||||
| Accumulated deficit |
(309,043 | ) | (319,370 | ) | ||||
| Total stockholders’ equity |
87,731 | 76,448 | ||||||
| Total liabilities and stockholders’ equity |
$ | 121,834 | $ | 115,564 | ||||
The accompanying notes are an integral part of these Consolidated Financial Statements.
- 43 -
WESTELL TECHNOLOGIES, INC. AND SUBSIDIARIES
CONSOLIDATED STATEMENTS OF OPERATIONS
(In thousands, except per share amounts)
| Fiscal Year Ended March 31, | ||||||||||||
| 2010 | 2009 | 2008 | ||||||||||
| As adjusted (See Note 3) |
||||||||||||
| Equipment revenue |
$ | 139,764 | $ | 140,713 | $ | 152,031 | ||||||
| Services revenue |
41,721 | 45,203 | 53,698 | |||||||||
| Total revenue |
181,485 | 185,916 | 205,729 | |||||||||
| Cost of equipment revenue |
102,374 | 109,763 | 117,412 | |||||||||
| Cost of services |
21,422 | 24,979 | 27,877 | |||||||||
| Total cost of equipment revenue and services |
123,796 | 134,742 | 145,289 | |||||||||
| Gross profit |
57,689 | 51,174 | 60,440 | |||||||||
| Operating expenses: |
||||||||||||
| Sales and marketing |
17,987 | 24,153 | 24,067 | |||||||||
| Research and development |
13,608 | 19,854 | 22,350 | |||||||||
| General and administrative |
15,095 | 20,036 | 21,537 | |||||||||
| Goodwill impairment |
— | 1,381 | 9,651 | |||||||||
| Intangible amortization |
641 | 1,882 | 1,834 | |||||||||
| Restructuring |
609 | 752 | 5,717 | |||||||||
| Total operating expenses |
47,940 | 68,058 | 85,156 | |||||||||
| Operating income (loss) |
9,749 | (16,884 | ) | (24,716 | ) | |||||||
| Other income (expense), net |
25 | 662 | 3,709 | |||||||||
| Interest (expense) |
(5 | ) | (15 | ) | (12 | ) | ||||||
| Income (loss) before income taxes, minority interest and discontinued operations |
9,769 | (16,237 | ) | (21,019 | ) | |||||||
| Income taxes |
558 | (77 | ) | (53,495 | ) | |||||||
| Minority interest |
— | (74 | ) | (260 | ) | |||||||
| Net income (loss) from continuing operations |
10,327 | (16,388 | ) | (74,774 | ) | |||||||
| Income (loss) from discontinued operations, net of tax of $ — , $ 0 and $ 208, respectively |
— | (206 | ) | (1,456 | ) | |||||||
| Net income (loss) |
$ | 10,327 | $ | (16,594 | ) | $ | (76,230 | ) | ||||
| Basic net income (loss) per share: |
||||||||||||
| Basic net income (loss) from continuing operations |
$ | 0.15 | $ | (0.24 | ) | $ | (1.06 | ) | ||||
| Basic net income (loss) from discontinued operations |
$ | — | $ | (0.00 | ) | $ | (0.02 | ) | ||||
| Basic net income (loss) per share |
$ | 0.15 | $ | (0.24 | ) | $ | (1.08 | ) | ||||
| Diluted net income (loss) per share: |
||||||||||||
| Diluted net income (loss) from continuing operations |
$ | 0.15 | $ | (0.24 | ) | $ | (1.06 | ) | ||||
| Diluted net income (loss) from discontinued operations |
$ | — | $ | (0.00 | ) | $ | (0.02 | ) | ||||
| Diluted net income (loss) per share |
$ | 0.15 | $ | (0.24 | ) | $ | (1.08 | ) | ||||
| Weighted-average number of shares outstanding: |
||||||||||||
| Basic |
67,987 | 69,470 | 70,376 | |||||||||
| Diluted |
68,573 | 69,470 | 70,376 | |||||||||
The accompanying notes are an integral part of these Consolidated Financial Statements.
- 44 -
WESTELL TECHNOLOGIES, INC. AND SUBSIDIARIES
CONSOLIDATED STATEMENTS OF STOCKHOLDERS’ EQUITY
AND COMPREHENSIVE INCOME (LOSS)
(In thousands)
| Comprehensive Income |
Common Stock Class A |
Common Stock Class B |
Additional Paid-in Capital |
Cumulative Translation Adjustment |
Accumulated Deficit |
Treasury Stock |
Total Stockholders’ Equity |
||||||||||||||||||||||||
| Balance, March 31, 2007 |
$ | 564 | $ | 147 | $ | 393,335 | $ | 86 | $ | (226,546 | ) | $ | (247 | ) | $ | 167,339 | |||||||||||||||
| Net income (loss) |
$ | (76,230 | ) | — | — | — | — | (76,230 | ) | — | (76,230 | ) | |||||||||||||||||||
| Translation adjustment |
840 | — | — | — | 840 | — | — | 840 | |||||||||||||||||||||||
| Total comprehensive (loss) |
$ | (75,390 | ) | ||||||||||||||||||||||||||||
| Options exercised |
3 | — | 337 | — | — | — | 340 | ||||||||||||||||||||||||
| Contineo, stock issuance costs |
— | — | 9 | — | — | — | 9 | ||||||||||||||||||||||||
| Treasury Stock |
— | — | — | — | — | (52 | ) | (52 | ) | ||||||||||||||||||||||
| Shares sold under Employee Stock Purchase Plan |
1 | — | 102 | — | — | — | 103 | ||||||||||||||||||||||||
| Restricted stock forfeitures |
(1 | ) | — | — | — | — | — | (1 | ) | ||||||||||||||||||||||
| Stock-based compensation |
— | — | 1,217 | — | — | — | 1,217 | ||||||||||||||||||||||||
| Tax benefits related to stock-option exercises |
— | — | (70 | ) | — | — | — | (70 | ) | ||||||||||||||||||||||
| Balance, March 31, 2008 |
$ | 567 | $ | 147 | $ | 394,930 | $ | 926 | $ | (302,776 | ) | $ | (299 | ) | $ | 93,495 | |||||||||||||||
| Net income (loss) |
$ | (16,594 | ) | — | — | — | — | (16,594 | ) | — | (16,594 | ) | |||||||||||||||||||
| Translation adjustment |
(1,132 | ) | — | — | — | (1,132 | ) | — | — | (1,132 | ) | ||||||||||||||||||||
| Total comprehensive (loss) |
$ | (17,726 | ) | ||||||||||||||||||||||||||||
| Options exercised |
1 | — | 98 | — | — | — | 99 | ||||||||||||||||||||||||
| Treasury Stock |
(29 | ) | — | — | — | — | (1,605 | ) | (1,634 | ) | |||||||||||||||||||||
| Shares sold under Employee Stock Purchase Plan |
0 | — | 22 | — | — | — | 22 | ||||||||||||||||||||||||
| Stock-based compensation |
— | — | 2,192 | — | — | — | 2,192 | ||||||||||||||||||||||||
| Balance, March 31, 2009 (As adjusted, See Note 3) |
$ | 539 | $ | 147 | $ | 397,242 | $ | (206 | ) | $ | (319,370 | ) | $ | (1,904 | ) | $ | 76,448 | ||||||||||||||
| Net income (loss) |
$ | 10,327 | — | — | — | — | 10,327 | — | 10,327 | ||||||||||||||||||||||
| Translation adjustment |
851 | — | — | — | 851 | — | — | 851 | |||||||||||||||||||||||
| Total comprehensive income |
$ | 11,178 | |||||||||||||||||||||||||||||
| Options exercised |
0 | — | 4 | — | — | — | 4 | ||||||||||||||||||||||||
| Treasury Stock |
(12 | ) | — | (19 | ) | — | — | (1,398 | ) | (1,429 | ) | ||||||||||||||||||||
| Restricted stock grant, net of forfeitures |
1 | — | — | — | — | — | 1 | ||||||||||||||||||||||||
| Stock-based compensation |
— | — | 1,529 | — | — | — | 1,529 | ||||||||||||||||||||||||
| Balance, March 31, 2010 |
$ | 528 | $ | 147 | $ | 398,756 | $ | 645 | $ | (309,043 | ) | $ | (3,302 | ) | $ | 87,731 | |||||||||||||||
The accompanying notes are an integral part of these Consolidated Financial Statements.
- 45 -
WESTELL TECHNOLOGIES, INC. AND SUBSIDIARIES
CONSOLIDATED STATEMENTS OF CASH FLOWS
(In thousands)
| Fiscal Year Ended March 31, | ||||||||||||
| 2010 | 2009 | 2008 | ||||||||||
| As adjusted (See Note 3) |
||||||||||||
| Cash flows from operating activities: |
||||||||||||
| Net income (loss) |
$ | 10,327 | $ | (16,594 | ) | $ | (76,230 | ) | ||||
| Reconciliation of net income (loss) to net cash provided by (used in) operating activities: |
||||||||||||
| Depreciation and amortization |
3,793 | 5,821 | 7,852 | |||||||||
| Goodwill impairment |
— | 1,381 | 9,651 | |||||||||
| Stock-based compensation |
1,529 | 2,192 | 1,217 | |||||||||
| Exchange (gain) loss |
(160 | ) | 234 | (112 | ) | |||||||
| (Gain) loss on sale or disposal of fixed assets |
19 | (63 | ) | 66 | ||||||||
| Restructuring |
609 | 966 | 6,221 | |||||||||
| Deferred taxes |
— | — | 53,615 | |||||||||
| Minority interest |
— | 74 | 260 | |||||||||
| Changes in assets and liabilities: |
||||||||||||
| Accounts receivable |
3,349 | (1,780 | ) | 6,797 | ||||||||
| Inventory |
(812 | ) | (2,587 | ) | 895 | |||||||
| Prepaid expenses and other current assets |
3,249 | (4,545 | ) | 316 | ||||||||
| Other assets |
815 | (728 | ) | 260 | ||||||||
| Deferred revenue – long-term |
(1,630 | ) | 2,377 | — | ||||||||
| Accounts payable and accrued expenses |
(4,308 | ) | 4,121 | (11,444 | ) | |||||||
| Accrued compensation |
726 | (5,573 | ) | (1,218 | ) | |||||||
| Net cash provided by (used in) operating activities |
17,506 | (14,704 | ) | (1,854 | ) | |||||||
| Cash flows from investing activities: |
||||||||||||
| Purchases of property and equipment |
(948 | ) | (2,381 | ) | (4,735 | ) | ||||||
| Proceeds from the sale of equipment |
— | 90 | 2,292 | |||||||||
| Sale (purchase) of investments |
— | 2,602 | (618 | ) | ||||||||
| Acquisition of minority interest |
— | (3,650 | ) | — | ||||||||
| Net cash provided by (used in) investing activities |
(948 | ) | (3,339 | ) | (3,061 | ) | ||||||
| Cash flows from financing activities: |
||||||||||||
| Borrowing (repayment) of debt and leases payable |
(43 | ) | 121 | (5 | ) | |||||||
| Purchase of treasury stock |
(1,429 | ) | (1,634 | ) | (52 | ) | ||||||
| Proceeds from stock options exercised |
4 | 121 | 443 | |||||||||
| Tax benefits related to stock-based compensation |
— | — | (70 | ) | ||||||||
| Net cash provided by (used in) financing activities |
(1,468 | ) | (1,392 | ) | 316 | |||||||
| Effect of exchange rate changes on cash |
167 | (254 | ) | 163 | ||||||||
| Net increase (decrease) in cash |
15,257 | (19,689 | ) | (4,436 | ) | |||||||
| Cash and cash equivalents, beginning of period |
46,058 | 65,747 | 70,183 | |||||||||
| Cash and cash equivalents, end of period |
$ | 61,315 | $ | 46,058 | $ | 65,747 | ||||||
| Supplemental disclosures of cash flow information: |
||||||||||||
| Cash paid for interest |
$ | 7 | $ | 17 | $ | 17 | ||||||
| Cash paid for income taxes, net |
$ | 161 | $ | 179 | $ | 409 | ||||||
The accompanying notes are an integral part of these Consolidated Financial Statements.
- 46 -
WESTELL TECHNOLOGIES, INC. AND SUBSIDIARIES
NOTES TO CONSOLIDATED FINANCIAL STATEMENTS
Note 1. Basis of Presentation:
Description of Business
Westell Technologies, Inc. (the “Company”) is a holding company. Its wholly owned subsidiary, Westell, Inc., designs and distributes telecommunications products which are sold primarily to major telephone companies. During December 2008, Conference Plus, Inc. (“ConferencePlus” or “CP”) became a wholly owned subsidiary when the Company purchased the remaining 8.5% minority interest. ConferencePlus provides audio, web and video conferencing services to various customers. Conference Plus Global Services, Ltd. is a wholly owned subsidiary of ConferencePlus that provides services similar to ConferencePlus. Noran Tel, Inc., a manufacturer of transmission, power distribution and remote monitoring products, is a wholly owned subsidiary of Westell, Inc. In the first quarter of the fiscal year ended March 31, 2009 (“fiscal year 2009”), the Company decided to cease the operations of Westell Limited, which was a wholly owned subsidiary of Westell, Inc. Westell Limited is shown as discontinued operations in the Company’s Consolidated Statements of Operations (See Note 4 for further information on discontinued operations).
Principles of Consolidation
The accompanying Consolidated Financial Statements include the accounts of the Company, its wholly owned subsidiaries, and Contineo Systems, Inc. (“Contineo”) a variable interest entity for which the Company is considered the primary beneficiary. The Consolidated Financial Statements have been prepared using accounting principles generally accepted in the United States (“GAAP”). All intercompany accounts and transactions have been eliminated in consolidation. The preparation of financial statements in conformity with GAAP requires management to make estimates and assumptions that affect the reported amounts of assets and liabilities and disclosure of contingent assets and liabilities at the date of the financial statements and revenue and expenses during the period reported. Estimates are used when accounting for the allowance for uncollectible accounts receivable, the allocation of relative selling prices in contracts with multiple elements, net realizable value of inventory, product warranty accrued, stock-based compensation, depreciation, income taxes, and contingencies, among other things. Actual results could differ from those estimates. In addition, certain reclassification adjustments have been made to historical results to achieve consistency in presentation.
Codification
In June 2009, the Financial Accounting Standards Board (“FASB”) issued Accounting Standards Update (“ASU”) 2009-01, Generally Accepted Accounting Principles amendments based on Statement of Financial Accounting Standards 168 – The FASB Accounting Standards Codification and the Hierarchy of Generally Accepted Accounting Principles” which established the FASB Accounting Standards Codification (“the Codification” or “ASC”) as the official single source of authoritative GAAP. All existing accounting standards are superseded. All other accounting guidance not included in the Codification will be considered non-authoritative. Following the Codification, the FASB will not issue new standards in the forms of Statements, FASB Staff Positions or Emerging Issues Task Force (“EITF”) Abstracts. Instead, FASB will issue ASU’s which will update the Codification. The Codification is not intended to change GAAP, but it does change the way GAAP is presented and organized. The Codification was effective for the Company’s fiscal second quarter 2010 financial statements. The principal impact of this adoption is limited to disclosures, and all references to authoritative accounting guidance have been updated to reference the Codification.
Business Acquisitions
During December 2008, ConferencePlus became a wholly owned subsidiary when the Company purchased the remaining 8.5% minority interest consisting of 2,398,114 shares for approximately $3.7 million. In accordance with FASB Statement of Financial Accounting Standards (“FAS”) 141, Business Combinations, as codified in ASC topic 805, Business Combinations (“ASC 805”), the purchase price of $3.7 million was allocated to the tangible and intangible assets acquired and liabilities assumed based upon their
- 47 -
WESTELL TECHNOLOGIES, INC. AND SUBSIDIARIES
NOTES TO CONSOLIDATED FINANCIAL STATEMENTS—(Continued)
estimated fair values at the acquisition date. This resulted in a $266,000 intangible asset that will be amortized over a 5 year life and tested for impairment in accordance with FAS 144, Accounting for the Impairment or Disposal of Long-Lived Assets, as codified in ASC topic 360, Property, Plant, and Equipment (“ASC 360”).
On October 2, 2007, the Company paid $2.5 million cash to acquire a 40% equity ownership interest in Contineo, a software development company based in Plano, Texas, to advance the Company’s research and development efforts. Contineo specializes in identity-management solutions which can be applied to secure broadband applications across a network. The Company received an exclusive license for an identified set of customers in North America to certain Contineo software in connection with the investment. The Company’s investment is in the form of preferred stock which entitles the Company to 8% cumulative non-compounding dividends and a liquidation preference over common stock. The Company has the right, but not the obligation, to participate in future equity funding. The Company does not intend to participate in future funding. The preferred stock converts to common stock in the event that certain agreed-upon objectives are met and additional funding of $2.5 million is provided, or upon a public offering exceeding $30.0 million.
The Company evaluated Contineo using the FASB Interpretation 46(R), Consolidation of Variable Interest Entities (“VIE”), as codified in ASC topic 810, Consolidation (“ASC 810”), and concluded that Contineo is a VIE and the Company is considered the primary beneficiary of the VIE, as the Company is the sole source of start-up funding. Contineo’s financial statements therefore are fully consolidated and include Contineo net losses of $404,000, $1.5 million and $896,000 during the fiscal years 2010, 2009 and 2008, respectively. As of March 31, 2010, the Company has recorded $2.8 million of cumulative losses related to Contineo. Contineo had approximately $0 and $173,000 of cash as of March 31, 2010 and 2009, respectively, which is included in the cash and cash equivalents line on the Consolidated Balance Sheet. The creditors of Contineo have no recourse to the general credit of the Company.
Note 2. Summary of Significant Accounting Policies:
Cash and Cash Equivalents
Cash and cash equivalents consist of highly liquid investments with maturities of three months or less when purchased and include bank deposits and money market funds. Money market funds are accounted for as available-for-sale securities under the requirements of FAS 115, Accounting for Certain Investments in Debt and Equity Securities, as codified in ASC topic 320, Investments – Debt and Equity Securities (“ASC 320”) .
Concentrations of Credit Risk
Financial instruments that potentially subject the Company to concentrations of credit risk consist principally of cash equivalents and trade receivables. The Company currently invests its excess cash in money market funds. The Company’s U.S. bank deposits are fully insured under the Federal Deposit Insurance Corporation (“FDIC”).
Inventories
Inventories are stated at the lower of first-in, first-out (“FIFO”) cost or market value. The components of inventories are as follows:
| March 31, | ||||||||
| (in thousands) | 2010 | 2009 | ||||||
| Raw material |
$ | 8,106 | $ | 13,168 | ||||
| Finished goods |
14,843 | 8,346 | ||||||
| Reserve for excess and obsolete inventory and net realizable value |
(1,691 | ) | (1,336 | ) | ||||
| Total inventory |
$ | 21,258 | $ | 20,178 | ||||
- 48 -
WESTELL TECHNOLOGIES, INC. AND SUBSIDIARIES
NOTES TO CONSOLIDATED FINANCIAL STATEMENTS—(Continued)
Prepaid Expenses and Other Current Assets
The Company has prepaid and current assets consisting primarily of rebate receivables from vendors, prepaid product royalty, prepaid maintenance agreements and prepaid rent.
Property and Equipment
Property and equipment are stated at cost, net of deprecation and amortization. Depreciation and amortization is computed using the straight-line method over the estimated useful lives of the assets, or for leasehold improvements, the shorter of the remaining lease term or the estimated useful life, as follows:
| Machinery and equipment |
5-7 years | |
| Office, computer and research equipment |
2-5 years |
Depreciation expense was $3.2 million, $3.9 million and $6.0 million for fiscal years 2010, 2009 and 2008, respectively. In September 2007, the Company entered into a $2.1 million agreement to sell the manufacturing equipment that it no longer needed after the transition of its manufacturing process to offshore suppliers. The Company accelerated the depreciation on these assets to the residual value which included additional depreciation expense of $1.2 million for the year ended March 31, 2008 and recorded a loss of approximately $85,000 on the sale. In accordance with ASC 360, the Company assesses all of its long-lived assets, including intangibles, for impairment when impairment indicators are identified. If the carrying value of an asset exceeds its undiscounted cash flows, an impairment loss may be necessary. An impairment loss is calculated as the difference between the carrying value and the fair value of the asset. In fiscal year 2009, there was an impairment charge of $68,000 related to the Noran Tel reporting unit in the Outside Plant Systems (“OSPlant Systems” or “OSP”) segment. No such impairment losses were recorded in fiscal year 2010 or fiscal 2008.
Goodwill and Intangibles
The Company accounts for goodwill and other intangibles under FAS 142, Goodwill and Other Intangible Assets, as codified in ASC topic 350, Intangibles-Goodwill and Other (“ASC 350”). ASC 350 requires that these assets be reviewed for impairment at least annually. The Company currently has three reporting units that contain goodwill consisting of Noran Tel, Conference Plus, Inc., and Conference Plus Global Services, Ltd. A two-step approach is required to test goodwill for impairment for each reporting unit. The first step tests for impairment by applying fair value-based tests at the reporting unit level. The second step (if necessary) measures the amount of impairment by applying fair value-based tests to individual assets and liabilities within each reporting unit. The fair value of each reporting unit is estimated using a discounted cash flow methodology estimating future cash flow, discount rates, growth rates and other assumptions, as well as, current like-company market transactions. The Company performs its annual impairment test in the fourth quarter of each fiscal year or when an event occurs or circumstances change between annual tests that would more likely than not reduce the fair value of the reporting unit below its carrying value. The Company did not recognize any impairment loss on goodwill in fiscal year 2010.
During the third quarter of fiscal 2009, the Company performed an interim impairment test in accordance with ASC 350 due to the adverse economic environment at that time being a potential indicator that goodwill and/or intangibles could be impaired. A two-step approach was used to test goodwill for impairment for each reporting unit. The first step tests for impairment by comparing the fair value of each reporting unit to its carrying value, including goodwill. The second step, which was necessary for the Noran Tel reporting unit, measured the amount of impairment by comparing the implied fair value of goodwill determined to the carrying value of goodwill. The fair value of each reporting unit was estimated using a discounted cash flow methodology and current like-company market transactions. As a result of the interim test, a charge of approximately $1.4 million was recorded during the quarter ended December 31, 2008 to write down goodwill and intangible assets allocated to the Noran Tel reporting unit, which is included in the OSP segment.
As a result of the annual impairment testing in fiscal year 2008, the goodwill related to the prior acquisitions in the Westell, Inc. reporting unit in the combined equipment segments was impaired and a charge of $9.7 million was recorded to write-off the entire goodwill balance related to this reporting unit. No impairment was indicated in the other reporting units.
- 49 -
WESTELL TECHNOLOGIES, INC. AND SUBSIDIARIES
NOTES TO CONSOLIDATED FINANCIAL STATEMENTS—(Continued)
Changes in the carrying amounts of goodwill by reporting units are as follows:
| ConferencePlus | ConferencePlus Global Services |
NoranTel | Westell Inc. | Total | ||||||||||||||
| Gross Goodwill |
$ | 1,052 | $ | 322 | $ | 1,890 | $ | 9,651 | $ | 12,915 | ||||||||
| Accumulated Impairment |
— | — | — | (9,651 | ) | (9,651 | ) | |||||||||||
| April 1, 2008 Balance, net |
1,052 | 322 | — | — | 3,264 | |||||||||||||
| Additions |
— | — | — | — | — | |||||||||||||
| Impairment |
— | — | (1,381 | ) | — | (1,381 | ) | |||||||||||
| Currency Translation |
— | — | 126 | — | 126 | |||||||||||||
| March 31, 2009 Balance, net |
1,052 | 322 | 635 | — | 2,009 | |||||||||||||
| Additions |
— | — | — | — | — | |||||||||||||
| Impairment |
— | — | — | — | — | |||||||||||||
| Currency Translation |
— | — | 153 | — | 153 | |||||||||||||
| March 31, 2010 Balance, net |
$ | 1,052 | $ | 322 | $ | 788 | $ | — | $ | 2,162 | ||||||||
On an ongoing basis, the Company reviews intangible assets and other long-lived assets other than goodwill for impairment whenever events and circumstances indicate that carrying values may not be recoverable. If such events or changes in circumstances occur, the Company will recognize an impairment loss if the undiscounted future cash flows expected to be generated by the asset are less than the carrying value of the related asset. The impairment loss would adjust the asset to its implied fair value.
Goodwill decreased by $1.3 million and $9.3 million during fiscal years 2009 and 2008, respectively. The decrease in fiscal year 2009 was due to a $1.4 million impairment charge in the Noran Tel reporting unit in the OSP segment and foreign currency changes. The decrease in fiscal year 2008 was due to the impairment charge recorded in the Westell Inc. reporting unit of $9.7 million, which was included in the equipment segments, final purchase price accounting adjustments and foreign currency changes. As of March 31, 2010, the Company had a total of $2.2 million of goodwill, of which $1.4 million was included in the ConferencePlus segment and $788,000 was included in the OSP segment.
The Company has finite and infinite-lived intangible assets related to its acquisitions. The following table presents details of the Company’s intangibles from acquisitions:
| March 31, | ||||||||
| (in thousands) | 2010 | 2009 | ||||||
| Gross intangible assets |
$ | 39,062 | $ | 39,037 | ||||
| Accumulated amortization |
(11,361 | ) | (10,720 | ) | ||||
| Foreign currency fluctuation |
230 | (116 | ) | |||||
| Impairment |
(23,868 | ) | (23,868 | ) | ||||
| Net |
$ | 4,063 | $ | 4,333 | ||||
These intangibles are being amortized over periods of 3 to 12 years. Finite-lived intangible amortization expense was $641,000, $1.9 million and $1.8 million in fiscal years 2010, 2009 and 2008, respectively. The following is the expected future amortization by year:
| 2011 | 2012 | 2013 | 2014 | 2015 | thereafter | |||||||||||||
| Intangible amortization expense |
$ | 657 | $ | 613 | $ | 599 | $ | 576 | $ | 535 | $ | 736 | ||||||
- 50 -
WESTELL TECHNOLOGIES, INC. AND SUBSIDIARIES
NOTES TO CONSOLIDATED FINANCIAL STATEMENTS—(Continued)
Net carrying amounts of intangible assets are as follows:
| March 31, | ||||||
| (in thousands) | 2010 | 2009 | ||||
| Finite-lived intangible assets: |
||||||
| Product technology (1) |
$ | 745 | $ | 838 | ||
| Customer relationships (1) |
2,971 | 3,215 | ||||
| Total finite-lived intangible assets, net |
$ | 3,716 | $ | 4,053 | ||
| Infinite-lived intangible assets: |
||||||
| Trade Name (2) |
347 | 280 | ||||
| Total intangible assets |
$ | 4,063 | $ | 4,333 | ||
| (1) | Change due to amortization and change in foreign currency exchange rate. |
| (2) | Change due to change in foreign currency exchange rate. |
Revenue Recognition and Deferred Revenue
Revenue recognition on equipment where software is incidental to the product as a whole or where software is essential to the equipment’s functionality and falls under software accounting scope exceptions generally occurs when products are shipped, risk of loss has transferred to the customer, objective evidence exists that customer acceptance provisions have been met, no significant obligations remain, collection is reasonably assured and warranty can be estimated.
Where multiple element arrangements exist, fair value of each element is established using the relative selling price method, which requires the Company to use vendor-specific objective evidence (“VSOE”), reliable third-party objective evidence (“TPE”) or management’s best estimate of selling price, in that order.
The Company’s UltraLine Series3 products are sold primarily to a single customer with contractual provisions that include specified future software enhancements and post customer support (“PCS”) to maintain ongoing interoperability within the customer’s network. The Company was not able to establish VSOE or TPE for the specified future software enhancements and therefore relied on management’s estimates of fair value for each of the multiple elements in the arrangement. Deferred revenue is recorded for undelivered elements. See Note 3 for a further description of revenue recognition relating to this product.
The Company’s product return policy allows customers to return unused equipment for partial credit if the equipment is non-custom, product is returned within specified time limits and is currently being manufactured and sold. Credit is not offered on returned products that are no longer manufactured and sold. The Company’s reserve for returns is not significant.
The Company’s ConferencePlus segment recognizes revenue for conference calls and other services upon completion of the conference call or services.
The Company records revenue net of taxes in accordance with EITF 06-3, How Taxes Collected from Customers and Remitted to Governmental Authorities Should Be Presented in the Income Statement, as codified in ASC topic 605, Revenue (“ASC 605”).
Shipping and Handling
The Company recorded costs related to shipping and handling expense of $1.0 million, $1.3 million and $1.3 million in sales and marketing expense for the years ended March 31, 2010, 2009 and 2008, respectively.
- 51 -
WESTELL TECHNOLOGIES, INC. AND SUBSIDIARIES
NOTES TO CONSOLIDATED FINANCIAL STATEMENTS—(Continued)
Product Warranties
Most of the Company’s products carry a limited warranty ranging from one to three years for Customer Networking Solutions (“CNS”) products and up to seven years for OSP products. The Company accrues for estimated warranty costs as products are shipped.
Research and Development Costs
Engineering and product research and development costs are charged to expense as incurred.
Stock-based Compensation
The Company applies ASC topic 718, Compensation – Stock Compensation (“ASC 718”), to account for stock-based compensation. ASC 718 requires all employee share-based payments be measured at fair value on the award’s grant date and be recognized in the financial statements over the requisite service period. Additionally, ASC 718 requires the benefits of tax deductions in excess of recognized compensation cost to be reported as a financing cash flow instead of as an operating cash flow as required under previous accounting literature. See Note 10 for further discussion of the Company’s share-based compensation plans.
Fair Value Measurements
The Company accounts for the fair value of assets and liabilities in accordance with FAS 157, Fair Value Measurements, as codified in ASC topic 820, Fair Value Measurements and Disclosures (“ASC 820”). ASC 820 defines fair value and establishes a framework for measuring fair value as required by other accounting pronouncements.
Foreign Currency Translation
The financial position and the results of operations of the Company’s foreign subsidiaries are measured using local currency as the functional currency. Assets and liabilities of these subsidiaries are translated at the exchange rate in effect at the end of each period. Income statement accounts are translated at the average rate of exchange prevailing during the period. Translation adjustments arising from differences in exchange rates from period to period are included in the foreign currency translation adjustment account in stockholders’ equity.
The Company records transaction gains (losses) for fluctuations on foreign currency rates on accounts receivable, cash and on intercompany accounts anticipated by management to be settled in the foreseeable future within the Other income (expense), net line on the Consolidated Statements of Operations.
Income Taxes
The Company accounts for income taxes under the provisions of FAS 109, Accounting for Income Taxes, as codified in ASC topic 740, Income Taxes (“ASC 740”). ASC 740 requires an asset and liability based approach in accounting for income taxes. Deferred income tax assets and liabilities are recorded based on the differences between the financial statement and tax basis of assets and liabilities, applying enacted statutory tax rates in effect for the year in which the tax differences are expected to reverse. Valuation allowances are provided against deferred tax assets, which are not likely to be realized. On a regular basis, management evaluates the recoverability of deferred tax assets and the need for a valuation allowance.
New Accounting Standards Adopted
On September 23, 2009, the FASB ratified the EITF’s final consensus on EITF 08-1, Revenue Arrangements with Multiple Deliverables and in October 2009, the FASB issued ASU 2009-13, Revenue Recognition (ASC Topic 605) – Multiple-Deliverable Revenue Arrangements (“ASU 2009-13”). ASU 2009-13 modified the fair value requirement of ACS topic 605 subtopic 25, Revenue Recognition-Multiple Element Arrangements (“ASU 605-25”), by allowing the use of the best estimate of selling price if vendor specific objective evidence (“VSOE”) or third-party evidence (“TPE”) of the selling price cannot be determined. It also prohibits the use of the residual method for allocating arrangement consideration. Effective for the quarter ended September 30, 2009, the
- 52 -
WESTELL TECHNOLOGIES, INC. AND SUBSIDIARIES
NOTES TO CONSOLIDATED FINANCIAL STATEMENTS—(Continued)
Company elected to early adopt ASU 2009-13 with retrospective application. See Note 3 for a description of the impact of adopting this ASU.
On September 23, 2009, the FASB ratified the EITF’s final consensus on EITF 09-3, Certain Revenue Arrangements That Include Software Elements and in October 2009, the FASB issued ASU 2009-14, Software (ASC Topic 985) – Certain Revenue Arrangements That Include Software Elements (“ASU 2009-14”). ASU 2009-14 modified the scope of ASC topic 905 subtopic 605, Software-Revenue Recognition (“ASC 905-605”), to exclude tangible products that contain software which is essential to overall product functionality from software revenue recognition accounting rules. Effective for the quarter ended September 30, 2009, the Company elected to early adopt ASU 2009-14 with retrospective application. See Note 3 for a description of the impact of adopting this ASU.
Effective April 1, 2009, the Company adopted FAS 141(R), Business Combinations, as codified in ASC topic 805, Business Combinations (“ASC 805”). ASC 805 establishes the principles and requirements for how the acquirer: a) recognizes and measures in its financial statements the identifiable assets acquired, the liabilities assumed, and any noncontrolling interest in the acquiree, b) recognizes and measures goodwill acquired in the business combination or a gain from a bargain purchase, and c) determines what information to disclose to enable users of the financial statements to evaluate the nature and financial effects of the business combination. This Statement applies prospectively to business combinations with an acquisition date on or after the effective date. The adoption of ASC 805 did not have an immediate impact on the Company’s Consolidated Financial Statements.
Effective June 30, 2009, the Company adopted FAS 165, Subsequent Events, as codified in ASC topic 855, Subsequent Events (“ASC 855”), which was subsequently modified with ASU 2010-09, Subsequent Events (Topic 855): Amendments to Certain Recognition and Disclosure Requirements (“ASU 2010-09”). ASC 855 refers to subsequent events that provide additional evidence about conditions that existed at the balance-sheet date as “recognized subsequent events”. Subsequent events which provide evidence about conditions that arose after the balance-sheet date but prior to the issuance of the financial statements are referred to as “non-recognized subsequent events”. The adoption of ASC 855 and ASU 2010-19 did not have a material impact on the Company’s Consolidated Financial Statements.
New Accounting Pronouncements
In February 2010, the FASB issued ASU 2010-10, Consolidations (Topic 810): Amendments for Certain Investment Funds and in December 2009, the FASB issued ASU 2009-17, Consolidations (Topic 810): Improvements to Financial Reporting by Enterprises Involved with Variable Interest Entities. These ASU’s amend the FASB Accounting Standards Codification for FASB Statement 167. (See FAS 167 effective date below.)
Effective April 1, 2010, the Company adopted FAS 167, Amendments to FASB interpretation 46(R). This Statement amends FIN 46(R), as codified in ASC 810, to require the Company to perform an analysis of existing investments to determine whether variable interest or interests give the Company a controlling financial interest in a VIE. This analysis identifies the primary beneficiary of a VIE as the enterprise that has both the power to direct the activities of significant impact on a variable interest entity and the obligation to absorb losses or receive benefits from the VIE that could potentially be significant to the VIE. It also amends ASC 810 to require ongoing reassessments of whether an enterprise is the primary beneficiary of a variable interest entity. As a result of adoption, the Company is no longer considered the primary beneficiary of Contineo Systems, Inc. (“Contineo”), a variable interest entity for which the Company was considered the primary beneficiary and which required the financial performance of Contineo to be consolidated in the Company’s financial statements in fiscal years 2010, 2009 and 2008. Therefore, the Company will deconsolidate Contineo as of April 1, 2010. The deconsolidation of Contineo does not have a material impact on the Company’s financial statements.
Note 3. Retrospective Adoption of New Revenue Recognition Pronouncements
In October 2009, the FASB issued ASU 2009-13 and ASU 2009-14. Effective for the quarter ended September 30, 2009, the Company elected to early adopt these ASU’s with retrospective application. The Company believes the adoption of these new standards better reflects the Company’s economic performance. The retrospective adoption impacted only the interim financial quarter ended December 31, 2008 and all subsequent reporting periods.
- 53 -
WESTELL TECHNOLOGIES, INC. AND SUBSIDIARIES
NOTES TO CONSOLIDATED FINANCIAL STATEMENTS—(Continued)
The Company has one contract to sell its UltraLine Series3 (“ULS3”) product that was impacted by the adoption of these standards. The ULS3 contract began in August 2008, was amended in December 2009, and is a three-year contract with a one-year optional extension that may be elected by the customer. The ULS3 is a home networking gateway product in the Customer Networking Solutions (“CNS”) segment (see Note 13 for further information on segments), which delivers integrated IPTV (Internet Protocol TV) that delivers video-ready bandwidth through fiber, copper, coax or Ethernet. Prior to the Company’s adoption of ASU 2009-14, the Company determined this product fell within the scope of the software revenue recognition guidance. However, as a result of the scope exception to that guidance provided within ASU 2009-14, the Company has determined that this product should no longer be accounted for in accordance with the software revenue recognition guidance. Instead, the Company applied the revenue recognition guidance of SAB Topic 13 and the multiple-element arrangements guidance.
The contract has three separate units of accounting: tangible product, support, and specified software upgrades. The contract specifies the price and terms of the arrangement but does not have contractual minimums. Purchase orders are used by the customer to acquire product. Support is available to the customer throughout the warranty period, which is three years. Support primarily entails minor testing, trouble shooting, bug fixes and customer meetings. The contract also calls for specified software upgrades.
As VSOE and TPE of selling price are not available, the Company used its best estimate of selling price in applying the relative selling price (“RSP”) methodology. The Company’s process for establishing the best estimate of selling price for all of its products and services offerings in complex customized solutions is based on multiple factors, such as customer classifications, major products and services, competitive alternatives, customer forecasts, internal costs, profit objectives, pricing practices, and market conditions. The Company established the best estimate of selling price considering all of the relevant factors. The best estimate of selling price was allocated to each element in the contract based on the Company’s total estimated consideration to establish RSP, which is then applied to non-contingent consideration to determine the amount of revenue per element to recognize and defer. Based on these factors, the Company originally determined that approximately 98% of the arrangement consideration should be allocated to the tangible product, approximately 1% to post contract support and approximately 1% to specified software upgrades based on the RSP approach. The RSP was reevaluated by the Company with the signing of the amendment in December 2009. Based on the current RSP and estimated total consideration, approximately 95% of the post-amendment arrangement consideration will be allocated to the tangible product, approximately 1% to post-contract support and approximately 4% to specified software upgrades prospectively as product ships under the amended agreement.
Prior to the adoption of these standards, the Company accounted for the ULS3 sales under this contract using software accounting rules. Under software accounting rules, VSOE had to be established for all units of accounting in order to allocate the transaction consideration using the relative selling price model. Because the transaction requires the delivery of a specified upgrade, the Company was not able to establish VSOE for all of the various units of accounting. As a result, all revenue and direct costs were deferred under the historical software accounting rules until the delivery of the final element in the arrangement.
As a result of the adoption of ASU 2009-13 and ASU 2009-14, the Company’s policy is to recognize the previously deferred revenue and related costs on the tangible product when it is delivered based on the established RSP. Revenue attributed to support will be recognized ratably over the three-year period that support is offered, and revenue allocated to the specified software upgrades will be recognized when the upgrades are delivered or when the Company contractually is no longer required to provide them. Revenue on specified software upgrades remains deferred at this time.
- 54 -
WESTELL TECHNOLOGIES, INC. AND SUBSIDIARIES
NOTES TO CONSOLIDATED FINANCIAL STATEMENTS—(Continued)
The primary impacts of retrospective adoption of the new accounting standards on the Consolidated Statements of Operations are as follows:
| Three Months Ended | ||||||||||||||||||||
| (in thousands) | Dec. 31, 2008 |
Mar. 31, 2009 |
June 30, 2009 |
Sep. 30, 2009 |
Dec. 31, 2009 |
Mar. 31, 2010 | ||||||||||||||
| Revenue: |
||||||||||||||||||||
| Pre-adoption revenue |
$ | 38,301 | $ | 41,725 | $ | 40,474 | $ | 41,691 | $ | 39,218 | $ | 37,501 | ||||||||
| Adoption impact on revenue |
10,454 | 14,258 | 13,039 | 5,662 | 3,578 | 322 | ||||||||||||||
| Post-adoption revenue |
48,755 | 55,983 | 53,513 | 47,353 | 42,796 | 37,823 | ||||||||||||||
| Gross profit: |
||||||||||||||||||||
| Pre-adoption gross profit |
12,328 | 12,789 | 14,779 | 14,495 | 13,680 | 14,093 | ||||||||||||||
| Adoption impact on gross profit |
44 | 56 | 428 | 77 | 91 | 46 | ||||||||||||||
| Post-adoption gross profit |
12,372 | 12,845 | 15,207 | 14,572 | 13,771 | 14,139 | ||||||||||||||
| Operating income (loss): |
||||||||||||||||||||
| Pre-adoption operating income (loss) |
(4,147 | ) | (2,380 | ) | 1,616 | 2,907 | 1,976 | 2,608 | ||||||||||||
| Adoption impact on operating income (loss) |
44 | 56 | 428 | 77 | 91 | 46 | ||||||||||||||
| Post-adoption operating income (loss) |
(4,103 | ) | (2,324 | ) | 2,044 | 2,984 | 2,067 | 2,654 | ||||||||||||
| (in thousands) | Three Months Ended | |||||||||||||||||||
| Dec. 31, 2008 |
Mar. 31, 2009 |
June 30, 2009 |
Sep. 30, 2009 |
Dec. 31, 2009 |
Mar. 31, 2010 | |||||||||||||||
| Net income (loss) per common share: |
||||||||||||||||||||
| Pre-adoption diluted per share |
$ | (0.06 | ) | $ | (0.03 | ) | $ | 0.02 | $ | 0.04 | $ | 0.04 | $ | 0.04 | ||||||
| Adoption impact on diluted per share |
0.00 | 0.00 | 0.01 | 0.00 | 0.00 | 0.00 | ||||||||||||||
| Post-adoption diluted per share |
$ | (0.06 | ) | $ | (0.03 | ) | $ | 0.03 | $ | 0.04 | $ | 0.04 | $ | 0.04 | ||||||
The primary impact of retrospective adoption through September 30, 2009 and the current period impact subsequent to the adoption of the accounting standards on the balance sheets for all periods presented are as follows:
| (in thousands) | Dec. 31, 2008 |
Mar. 31, 2009 |
June 30, 2009 |
Sep. 30, 2009 |
Dec. 31, 2009 |
Mar. 31, 2010 |
||||||||||||||||||
| Deferred revenue: |
||||||||||||||||||||||||
| Pre-adoption deferred revenue |
$ | 11,784 | $ | 27,377 | $ | 40,728 | $ | 44,381 | $ | 48,081 | $ | 48,347 | ||||||||||||
| Adoption impact on deferred revenue |
(10,454 | ) | (24,712 | ) | (37,752 | ) | (43,414 | ) | (46,991 | ) | (47,313 | ) | ||||||||||||
| Post-adoption deferred revenue |
$ | 1,330 | $ | 2,665 | $ | 2,976 | $ | 967 | $ | 1,090 | $ | 1,034 | ||||||||||||
| Deferred costs: |
||||||||||||||||||||||||
| Pre-adoption deferred costs |
$ | 11,040 | $ | 24,612 | $ | 37,207 | $ | 42,589 | $ | 46,076 | $ | 46,473 | ||||||||||||
| Adoption impact on deferred costs |
(10,410 | ) | (24,612 | ) | (37,207 | ) | (42,589 | ) | (46,076 | ) | (46,473 | ) | ||||||||||||
| Post-adoption deferred costs |
$ | 630 | $ | — | $ | — | $ | — | $ | — | $ | — | ||||||||||||
Note 4. Discontinued Operations:
In the first quarter of fiscal year 2009, the Company decided to cease the operations of the Westell Limited subsidiary in the UK. All employees of the subsidiary have been terminated and the facility has been closed. The results of operations of Westell Limited have been classified as discontinued operations for the years ended March 31, 2009 and 2008. The Westell Limited entity was dissolved and therefore no assets or liabilities exist at March 31, 2009. The fiscal years 2009 and 2008 Consolidated Statements of Cash Flows include discontinued operations.
- 55 -
WESTELL TECHNOLOGIES, INC. AND SUBSIDIARIES
NOTES TO CONSOLIDATED FINANCIAL STATEMENTS—(Continued)
Note 5. Revolving Credit Agreements and Debt:
The Company entered into a revolving credit agreement with The Private Bank and Trust Company dated as of March 5, 2009 (the “Credit Agreement”). Effective March 5, 2010, the Company entered into a first amendment (the “Amendment”) to its Credit Agreement to extend the maturity date to March 31, 2011 and amended certain other provisions. The Credit Agreement is an asset-based revolving credit facility in an amount up to $12.0 million based on 80% of eligible accounts receivable plus the lesser of 30% of eligible inventory or $3.0 million. The obligations of the Company under the Credit Agreement are secured by a guaranty from certain direct and indirect domestic subsidiaries of the Company, and by substantially all of the assets of the Company.
The revolving loans under the Credit Agreement bear interest at the greater of the London Interbank Offered Rate (“LIBOR”) plus a spread of 2.5%, or an alternative base rate. The alternative base rate is the greater of prime rate or the Federal Funds rate plus 0.25% (the “Base Rate”). The Company is also required to pay a non-use fee of 0.35% per annum on the unused portion of the revolving loans. These fees are waived if the Company maintains with the lender an average monthly demand deposit account balance of $5.0 million and an average monthly investment balance of $15.0 million.
The Credit Agreement contains financial covenants that include a minimum EBITDA, a minimum tangible net worth and a limitation on capital expenditures for any fiscal year. The Company was in compliance with these covenants on March 31, 2010. As of March 31, 2010, the Company had $12.0 million available on the credit facility with no borrowings.
In addition, although the Company has never declared or paid any cash dividends on its common stock and does not anticipate paying any cash dividends in the foreseeable future, the Company’s credit facility restricts the Company’s ability to pay dividends without bank approval.
Note 6. Income Taxes:
The Company utilizes the liability method of accounting for income taxes and deferred taxes are determined based on the differences between the financial statements and tax basis of assets and liabilities given the provisions of the enacted tax laws. The income taxes charged to net income are summarized as follows:
| Fiscal Year Ended March 31, | ||||||||||||
| (in thousands) | 2010 | 2009 | 2008 | |||||||||
| Federal: |
||||||||||||
| Current |
$ | (589 | ) | $ | — | $ | 48 | |||||
| Deferred |
— | — | 47,682 | |||||||||
| (589 | ) | — | 47,730 | |||||||||
| State: |
||||||||||||
| Current |
(156 | ) | 159 | (44 | ) | |||||||
| Deferred |
— | — | 5,724 | |||||||||
| (156 | ) | 159 | 5,680 | |||||||||
| Foreign: |
||||||||||||
| Current |
187 | (82 | ) | 85 | ||||||||
| Deferred |
— | — | — | |||||||||
| 187 | (82 | ) | 85 | |||||||||
| Total |
$ | (558 | ) | $ | 77 | $ | 53,495 | |||||
The Company utilizes the flow-through method to account for tax credits. In fiscal years 2010, 2009 and 2008, the Company generated alternative minimum tax credits of $178,000, $0 and $0, respectively. This $178,000 was recorded as expense in fiscal year 2010. Additionally, during fiscal year 2010, the Company realized a tax benefit relating to the refund of alternative minimum tax previously paid of $767,000.
- 56 -
WESTELL TECHNOLOGIES, INC. AND SUBSIDIARIES
NOTES TO CONSOLIDATED FINANCIAL STATEMENTS—(Continued)
The statutory federal income tax rate is reconciled to the Company’s effective income tax rates below:
| Fiscal Year Ended March 31, | |||||||||
| 2010 | 2009 | 2008 | |||||||
| Statutory federal income tax rate |
35.0 | % | 35.0 | % | 35.0 | % | |||
| Meals and entertainment |
0.3 | (0.3 | ) | (0.3 | ) | ||||
| State income tax, net of federal tax effect |
2.4 | (0.7 | ) | 2.7 | |||||
| Valuation allowance |
(38.9 | ) | (33.1 | ) | (274.1 | ) | |||
| Goodwill impairment |
— | — | (16.1 | ) | |||||
| Contingent tax reserves |
(3.0 | ) | (0.3 | ) | 0.3 | ||||
| Other |
(1.5 | ) | (1.1 | ) | (2.0 | ) | |||
| (5.7 | )% | (0.5 | )% | (254.5 | )% | ||||
Components of the net deferred income tax asset are as follows:
| March 31, | ||||||||
| (in thousands) | 2010 | 2009 | ||||||
| Deferred income tax assets: |
||||||||
| Allowance for doubtful accounts |
$ | 26 | $ | 77 | ||||
| Alternative minimum tax credit |
1,180 | 1,803 | ||||||
| Research and development credit carryforward |
3,885 | 4,346 | ||||||
| Compensation accruals |
2,882 | 1,520 | ||||||
| Inventory reserves |
641 | 528 | ||||||
| Warranty reserve |
148 | 258 | ||||||
| Net operating loss carryforward |
54,304 | 57,925 | ||||||
| Intangibles |
1,445 | 1,845 | ||||||
| Other |
2,459 | 2,964 | ||||||
| 66,970 | 71,266 | |||||||
| Valuation allowance |
(61,297 | ) | (65,108 | ) | ||||
| Net deferred income tax asset |
$ | 5,673 | $ | 6,158 | ||||
Classified in Consolidated Balance Sheet as follows:
| March 31, | ||||||||
| (in thousands) | 2010 | 2009 | ||||||
| Deferred income tax assets- included in noncurrent other assets |
$ | 5,985 | $ | 6,448 | ||||
| Deferred income tax liability – included in other long-term liabilities |
(312 | ) | (290 | ) | ||||
| Net deferred income tax asset |
$ | 5,673 | $ | 6,158 | ||||
The Company has approximately $5.1 million in income tax credit carryforwards and a $139.1 million federal net operating loss carryforward that is available to offset taxable income in the future. Income tax credits of $589,000 were refunded during fiscal year 2010, and $462,000, which were reserved as unrecognized tax benefits, expired without being utilized. The tax credit carryforwards will begin to expire in fiscal year 2011. The federal net operating loss carryforward begins to expire in fiscal year 2020. State net operating loss carryforwards have varying carryforward periods from five to twenty years.
The Company evaluates the need for valuation allowances on the net deferred tax assets under the rules of ASC 740. In assessing the realizability of the deferred tax assets, the Company considered whether it is more likely than not that some portion or all of the deferred tax assets will not be realized through the generation of future taxable income. The Company generated net losses in fiscal years 2008 and 2009 resulting in a domestic three-year cumulative loss position. The Company considered the cumulative loss and other assessments and concluded that a full valuation allowance is still required as of March 31, 2010.
Effective April 1, 2007, the Company adopted FASB Interpretation 48, Accounting for Uncertainty in Income Taxes - an interpretation of FASB Statement 109, as codified in ASC 740, which prescribes a recognition threshold and
- 57 -
WESTELL TECHNOLOGIES, INC. AND SUBSIDIARIES
NOTES TO CONSOLIDATED FINANCIAL STATEMENTS—(Continued)
measurement of a tax position taken or expected to be taken in a tax return. ASC 740 also provides guidance on derecognition, classification, interest and penalties, accounting in interim periods, disclosure and transition. There was no cumulative effect adjustment to retained earnings as a result of this adoption. As of April 1, 2007, the Company had $1.0 million of unrecognized tax benefits which would impact the effective tax rate. As of March 31, 2008, the Company had approximately $679,000 of unrecognized tax benefits, net of federal tax benefits, that if recognized would impact the effective tax rate. During fiscal year 2010, $352,000 of uncertain positions plus $51,000 of previously anticipated interest expense relating to this liability were reversed and recognized as income because the statute of limitations expired on this potential exposure. This resulted in a $592,000 reduction of unrecognized tax benefits and a $189,000 reduction of a corresponding tax receivable. Furthermore, an additional $376,000 of unrecognized tax benefits will be recognized as income in fiscal year 2011, as the potential exposure related to the liability expired in April 2010. A liability for unrecognized tax benefits of $88,000 relating to a newly identified uncertain position was recorded in fiscal year 2010.
A reconciliation of the beginning and ending balances of the total amounts of unrecognized tax benefits for fiscal years 2009 and 2010 is as follows:
| (amounts in thousands) | ||||
| Unrecognized tax benefits at March 31, 2008 |
$ | 7,569 | ||
| Additions based on positions related to fiscal year 2009 |
— | |||
| Additions for tax positions of years prior to fiscal year 2009 |
47 | |||
| Reductions for tax positions of years prior to fiscal year 2009 |
— | |||
| Reductions as a result of expirations of applicable statutes of limitations |
— | |||
| Settlements |
— | |||
| Unrecognized tax benefits at March 31, 2009 |
$ | 7,616 | ||
| Additions based on positions related to fiscal year 2010 |
88 | |||
| Additions for tax positions of years prior to fiscal year 2010 |
22 | |||
| Reductions for tax positions of years prior to fiscal year 2010 |
— | |||
| Reductions as a result of expirations of applicable statutes of limitations |
(1,054 | ) | ||
| Settlements |
— | |||
| Unrecognized tax benefits at March 31, 2010 |
$ | 6,672 | ||
At March 31, 2010, the unrecognized tax benefits are presented in the other long-term liabilities line on the Consolidated Balance Sheet.
The Company recognizes interest and penalties related to unrecognized tax benefits as a component of income tax expense. The Company accrued $65,000 and $151,000 for the potential payment of interest related to unrecognized tax benefits as of March 31, 2010 and 2009, respectively.
The Company files its tax returns as prescribed by the tax laws of the jurisdictions in which it operates.
The major jurisdiction subject to examination by the relevant taxable authorities and open tax years are as follows:
| Jurisdiction |
Open Tax Years | |
| U.S. Federal |
1999-2010 | |
| U.S. State |
2000-2010 | |
| Foreign |
2005-2010 |
Note 7. Commitments and Contingencies:
The Company’s CNS and OSP segments lease a 185,000 square foot corporate facility in Aurora, Illinois, to house product distribution, engineering, sales, marketing and administration pursuant to a lease that originated in 1997 and runs through September 2017. The rental payments are currently $2.0 million a year and increase 2% every other year. The ConferencePlus segment leases approximately 42,000 square feet of office space in Schaumburg, Illinois, pursuant to a lease that was extended two years to run through July, 2013.
The Company also has commitments to lease other facilities in Canada and Ireland. All of the leases require the Company to pay utilities, insurance and real estate taxes on the facilities. Total rent expense was $3.2 million, $4.5 million and $3.9 million for fiscal years 2010, 2009 and 2008, respectively. In addition, the Company has leases for distribution and office equipment. In the fourth
- 58 -
WESTELL TECHNOLOGIES, INC. AND SUBSIDIARIES
NOTES TO CONSOLIDATED FINANCIAL STATEMENTS—(Continued)
quarter of fiscal year 2009, the Company recorded a $925,000 non-cash charge to correct an error in the Company’s accounting treatment related to the lease of its corporate headquarters and distribution facility. In accordance with FASB Technical Bulletin 88-1, Issues Related to Accounting of Leases, as codified in ASC topic 840, Leases (“ASC 840”) the Company has a long-term deferred lease liability of $835,000 and $890,000 presented in other long-term liabilities and a short-term deferred lease liability of $55,000 and $35,000 presented in accrued expenses on the Consolidated Balance Sheet as of March 31, 2010 and 2009, respectively, to account for uneven rental payments.
Future obligations and commitments as of March 31, 2010 consisted of the following:
| Payments due by fiscal year | |||||||||||||||||||||
| (in thousands) | 2011 | 2012 | 2013 | 2014 | 2015 | Thereafter | Total | ||||||||||||||
| Purchase obligations |
$ | 54,788 | $ | 82 | $ | 5 | $ | — | $ | — | $ | — | $ | 54,875 | |||||||
| Future minimum lease payments for operating leases |
3,057 | 2,763 | 2,643 | 2,296 | 2,135 | 5,936 | 18,830 | ||||||||||||||
| Future obligations and commitments |
$ | 57,845 | $ | 2,845 | $ | 2,648 | $ | 2,296 | $ | 2,135 | $ | 5,936 | $ | 73,705 | |||||||
Purchase obligations consist of raw materials in the combined equipment segments and local and long distance telephone service commitments in the ConferencePlus segment that arise in the normal course of business operations.
As a result of an ongoing vendor dispute in the ConferencePlus segment a $700,000 loss contingency reserve was recorded in cost of services in March 2009. The Company applies FAS 5, Accounting for Contingencies, as codified in ASC topic 450, Contingencies (“ASC 450”) in assessing the need for a reserve and concluded that this loss was both probable and estimable. The $700,000 contingency reserve is classified in accrued expenses as a current liability on the Consolidated Balance Sheet as of March 31, 2010 and 2009. In April 2010, a settlement agreement was reached for the amount recorded as of March 31, 2010.
In the quarter ended June 30, 2007, the Company recorded a gain contingency using guidance under ASC 450 of $3.3 million related to the probable settlement of a claim to recover product warranty costs incurred by the Company for non-conforming product from a vendor. This recovery offset $600,000 of related costs recorded in the quarter ended June 30, 2007 and costs recorded in the prior fiscal year and were recorded in sales and marketing expense in the Consolidated Statements of Operations. In September 2007, a settlement agreement was reached with the vendor and the Company received the entire $3.3 million settlement in fiscal year 2008.
In the quarter ended December 31, 2006, the Company recorded a loss contingency related to a probable future settlement of $1.0 million as a purchase price adjustment for the cost to exit a HyperEdge purchase agreement that was outstanding as of the HyperEdge acquisition date. This purchase agreement was not recorded or disclosed to the Company prior to the acquisition. During the quarter ended December 31, 2007, the Company recorded an additional net expense of $300,000 related to this probable future settlement. The Company used guidance under ASC 450 and recorded a probable recovery comprised of an increase in the settlement loss of $1.0 million offset by a probable recovery of $0.7 million from former stockholders of HyperEdge. In January 2008, settlement agreements were finalized with both parties for the amounts recorded as of December 31, 2007.
Note 8. Product Warranties:
Most of the Company’s products carry a limited warranty ranging from one to three years for CNS products and up to seven years for OSP products. The specific terms and conditions of those warranties vary depending upon the customer and the product sold. Factors that enter into the estimate of the Company’s warranty reserve include: the number of units shipped historically, anticipated rates of warranty claims, and cost per claim. The Company periodically assesses the adequacy of its recorded warranty liability and adjusts the reserve as necessary. The current portions of the warranty reserve were $433,000 and $823,000 as of March 31, 2010 and 2009, respectively and are presented on the Consolidated Balance Sheets as accrued expenses. The long-term portions of the warranty reserve were $830,000 and $249,000 as of March 31, 2010 and 2009, respectively, and are presented on the Consolidated Balance Sheets as other long-term liabilities. The Company recorded $600,000 of product warranty expense during fiscal year 2008 related to a specific product warranty issue.
- 59 -
WESTELL TECHNOLOGIES, INC. AND SUBSIDIARIES
NOTES TO CONSOLIDATED FINANCIAL STATEMENTS—(Continued)
The following table presents the changes in our product warranty reserve:
| Fiscal Year Ended March 31, | ||||||||||||
| (in thousands) | 2010 | 2009 | 2008 | |||||||||
| Total product warranty reserve at the beginning of the period |
$ | 1,072 | $ | 932 | $ | 2,664 | ||||||
| Warranty expense |
899 | 562 | 1,227 | |||||||||
| Utilization |
(708 | ) | (422 | ) | (2,959 | ) | ||||||
| Total product warranty reserve at the end of the period |
$ | 1,263 | $ | 1,072 | $ | 932 | ||||||
Note 9. Capital Stock and Stock Restriction Agreements:
Capital Stock Activity
The Board of Directors has the authority to issue up to 1,000,000 shares of preferred stock in one or more series and to fix the rights, preferences, privileges and restrictions thereof, including dividend rights, conversion rights, voting rights, terms of redemption, liquidation preferences, sinking fund terms and the number of shares constituting any series or the designation of such series, without any further vote or action by stockholders.
Share Repurchase Program
In March 2008, the Board of Directors authorized a share repurchase program whereby the Company may repurchase up to an aggregate of $10.0 million of its outstanding common shares. During fiscal years 2010, 2009 and 2008, 1,252,861, 2,897,320 and 29,800 shares, respectively, were repurchased under this program with a weighted-average per share purchase price of $1.13, $ 0.56 and $1.76, respectively. On March 3, 2010, the scheduled expiration date of this program, the unused availability of $6,903,115 expired unused.
In February 2010, the Board of Directors authorized a share repurchase program whereby the Company may repurchase up to an aggregate of $10.0 million of its outstanding Class A Common Shares. There is $10.0 million remaining for additional treasury stock purchases under this program as of March 31, 2010.
Stock Restriction Agreements
The members of the Penny family (principal stockholders) have a Stock Transfer Restriction Agreement which prohibits, with limited exceptions, such members from transferring their Class A Common Stock or Class B Common Stock acquired prior to November 30, 1995, without first offering such stock to the other members of the Penny family. If converted, Class B stock converts on a one-for-one basis into shares of Class A Common Stock upon a transfer. As of March 31, 2010, a total of 14,693,619 shares of Class B Common Stock are subject to this Stock Transfer Restriction Agreement.
Voting Rights
The Company’s Common Stock is divided into two classes. Class A Common Stock is entitled to one vote per share while Class B common stock is entitled to four votes per share. The Company’s largest stockholder is a voting trust that owned 49.1% of the voting control of the Company as of May 13, 2010. The trust was formed for the benefit of Robert C. Penny III and Melvin J. Simon and their respective families. Certain Penny family members also own, or are beneficiaries of trusts, that own shares outside of the voting trust. As trustees of the Voting Trust and other trusts, Messrs. Penny and Simon control 53.1% of the voting power of the Company’s outstanding stock and therefore effectively control the Company.
- 60 -
WESTELL TECHNOLOGIES, INC. AND SUBSIDIARIES
NOTES TO CONSOLIDATED FINANCIAL STATEMENTS—(Continued)
Shares Issued and Outstanding
The following table summarizes Common Stock transactions for fiscal years 2008, 2009 and 2010:
| Common Shares Issued and Outstanding |
|||||||||
| (in thousands) | Class A | Class B | Treasury | ||||||
| Balance, March 31, 2007 |
56,437 | 14,742 | (93 | ) | |||||
| Options exercised |
250 | — | — | ||||||
| Shares sold under Employee Stock Purchase Plan |
59 | — | — | ||||||
| Purchase of Treasury Stock |
(30 | ) | — | (30 | ) | ||||
| Class B converted to Class A |
48 | (48 | ) | — | |||||
| Restricted stock forfeiture |
(68 | ) | — | — | |||||
| Balance, March 31, 2008 |
56,696 | 14,694 | (123 | ) | |||||
| Options exercised |
78 | — | — | ||||||
| Shares sold under Employee Stock Purchase Plan |
19 | — | — | ||||||
| Purchase of Treasury Stock |
(2,897 | ) | — | (2,897 | ) | ||||
| Restricted stock forfeiture |
(34 | ) | — | — | |||||
| Balance, March 31, 2009 |
53,862 | 14,694 | (3,020 | ) | |||||
| Options exercised |
15 | — | — | ||||||
| Purchase of Treasury Stock |
(1,253 | ) | — | (1,253 | ) | ||||
| Restricted stock grant, net of forfeitures |
138 | — | — | ||||||
| Balance, March 31, 2010 |
52,762 | 14,694 | (4,273 | ) | |||||
In April 2010, the Compensation Committee granted 70,000 restricted stock awards (“RSA’s”) to members of the board of directors and a target of 1.2 million restricted stock units (“RSU’s”) to executives. The RSA’s and half of the RSU’s vest in equal installments over the first four anniversary dates from April 1, 2010. The other half of the RSU’s are performance-based units under which 0 to 868,000 shares of Class A Common Stock could ultimately be earned, depending on actual fiscal 2011 results measured against target results. The Class A Common Stock ultimately earned from the performance-based units are also subject to further time-based vesting restrictions with 25% of the actual shares earned vesting upon determination of the fiscal year 2011 financial performance with the remaining 75% vesting in equal installments annually beginning April 1, 2012 and for each of the following two years. In accordance with ASC 718, these awards will be treated as equity awards.
Note 10. Stock-based Compensation:
The Company applies ASC 718, to account for employee stock-based compensation. ASC 718 requires all employee share-based payments be measured at fair value on the award’s grant date and be recognized in the financial statements over the requisite service period.
Employee Stock Incentive Plans
In September 2004, stockholders approved the Westell Technologies, Inc. 2004 Stock Incentive Plan (the “2004 SIP Plan”) that permits the issuance of restricted Class A Common Stock, nonqualified stock options, stock appreciation rights and performance share awards to selected officers, employees, and non-employee directors of the Company. There are a total of 5,616,510 shares available for issuance under this plan as of March 31, 2010.
Stock Options
Typically, stock options granted by the Company have an exercise price that is equal to the reported value of the Company’s stock on the grant date. Options usually vest over a period from two to five years, or upon the earlier of the achievement of Company and individual goals established, or at the end of 7 or 8 years. The Company’s options have a contractual term of 7 or 10 years. Generally, compensation expense is recognized ratably over the vesting period. Certain options provide for accelerated vesting if there is a change in control (as defined in the 2004 SIP Plan).
- 61 -
WESTELL TECHNOLOGIES, INC. AND SUBSIDIARIES
NOTES TO CONSOLIDATED FINANCIAL STATEMENTS—(Continued)
As permitted by ASC 718, the Company uses the Black-Scholes-Merton model to estimate the fair value of employee stock options on the date of grant. That model employs parameters for which the Company has made estimates according to the assumptions noted below. Expected volatilities were based on historical volatilities of the Company’s stock. The expected option lives were derived from the output of the options valuation model and represent the period of time that options granted are expected to be outstanding based on historical information. The risk-free interest rates were based on the United States Treasury yield curve for the term that mirrored the expected term in effect at the time of grant. The dividend yield was based on expected dividends at the time of grant.
The Company recorded expense of $1.4 million, $564,000 and $393,000 in the twelve months ended March 31, 2010, 2009 and 2008, respectively, related to stock options. During January 2010, the Company identified a $730,000 error in the calculation of stock-based compensation expense for the prior year periods. The Company’s third-party equity accounting software incorrectly calculated award forfeitures used in determining stock-based compensation expense that resulted in an understatement of stock-based compensation expense in certain periods prior to the grant’s final vesting date. The correction of the error during the third quarter of fiscal year 2010 resulted in changes to the timing of stock-based compensation expense over the vesting period of the awards during the relevant periods, but does not change the cumulative stock-based compensation expense related to those awards over time, as forfeitures are ultimately recorded to reflect the compensation expense for only those options that actually vest. Because stock-based compensation expense is a non-cash item, there is no impact to net cash provided by operations in any period. The cumulative impact of the $730,000 prior-years error is included as additional expense in the general and administrative expense line on the Condensed Consolidated Statements of Operations.
Cash received from option exercises for the years ended March 31, 2010, 2009 and 2008 were $4,000, $99,000 and $340,000, respectively. The total intrinsic value of options exercised during the years ended March 31, 2010, 2009 and 2008, was approximately $17,000, $32,000 and $242,000, respectively.
Option activity for the twelve months ended March 31, 2010 is as follows:
| Shares | Weighted- Average Exercise Price Per Share |
Weighted- Average Remaining Contractual Term (in years) |
Aggregate Intrinsic Value(a) (in thousands) | |||||||
| Outstanding on March 31, 2009 |
7,818,472 | 3.78 | 3.2 | — | ||||||
| Granted |
250,000 | 0.36 | ||||||||
| Exercised |
(15,000 | ) | 0.30 | |||||||
| Forfeited |
(436,969 | ) | 2.16 | |||||||
| Expired |
(1,119,993 | ) | 5.18 | |||||||
| Outstanding on March 31, 2010 |
6,496,510 | 3.52 | 3.2 | $ | 948 | |||||
| Vested or expected to vest as of March 31, 2010 |
5,666,784 | 3.78 | 2.8 | $ | 709 | |||||
| Exercisable on March 31, 2010 |
4,415,453 | 4.40 | 2.0 | $ | 242 | |||||
| (a) | The intrinsic value for the stock options is calculated based on the difference between the exercise price of the underlying awards and the average of the high and low Westell Technologies’ stock price as of the reporting date. |
ASC 718 requires recognition of stock-based compensation for the number of awards that are ultimately expected to vest. As of March 31, 2010, the Company used an estimated forfeiture rate of approximately 14%. The estimated forfeiture rate will be reassessed in subsequent periods and may change based on new facts and circumstances.
As of March 31, 2010, there was $1.1 million of pre-tax stock option compensation expense related to non-vested awards not yet recognized, including estimated forfeitures, which is expected to be recognized over a weighted-average period of 2.49 years.
- 62 -
WESTELL TECHNOLOGIES, INC. AND SUBSIDIARIES
NOTES TO CONSOLIDATED FINANCIAL STATEMENTS—(Continued)
The fair value of each option was estimated on the date of grant using the Black-Scholes-Merton option pricing model with the following weighted-average assumptions:
| Fiscal Year Ended March 31 | ||||||||||||
| 2010 | 2009 | 2008 | ||||||||||
| Input assumptions: |
||||||||||||
| Expected volatility |
65 | % | 57 | % | 54 | % | ||||||
| Risk-free interest rate |
1.8 | % | 2.8 | % | 4.7 | % | ||||||
| Expected life |
5 years | 5 years | 5 years | |||||||||
| Expected dividend yield |
0.0 | % | 0.0 | % | 0.0 | % | ||||||
| Output weighted-average-grant-date fair value |
$ | 0.20 | $ | 0.61 | $ | 1.35 | ||||||
The Company issues new shares of stock when stock options are exercised.
Non-qualified Non-public Subsidiary Stock Options
The Company’s ConferencePlus subsidiary has a stock option plan for the purchase of ConferencePlus stock. There are 2,679,245 shares reserved for issuance under this plan. Stock options granted under this plan have an exercise price that is equal to the calculated value of ConferencePlus stock on the grant date based on a discounted cash flow method and a contractual term of 10 years. Typically, options vest on the fifth anniversary of the options grant date and compensation is expensed ratably over that period. Per the original terms of the option awards, acceleration of vesting may occur due to the following events: an initial public offering, a spin off, or a change in control of ConferencePlus. There were no options granted in fiscal year 2010. The options granted in fiscal year 2009 were to replace options that expired during the year. The fiscal year 2009 options were issued with exercise price equal to the exercise price of the expiring options and with immediate vesting. The expense for this grant was therefore recognized immediately.
ConferencePlus uses the Black-Scholes-Merton model to estimate the calculated value of employee stock options on the date of grant. That model employs parameters for which the Company has made estimates according to the assumptions noted below. Because ConferencePlus stock is not traded on an exchange nor does it have an internal market for its shares, expected volatilities were based on historical stock volatilities for comparable public companies stock for a period of time comparable to the expected term of the options. The expected option lives were derived from the output of the options valuation model and represent the period of time that options granted are expected to be outstanding which is estimated based on historical information. The risk-free interest rates were based on the United States Treasury yield curve for the term that mirrored the expected term in effect at the time of grant. The dividend yield was based on expected dividends at the time of grant.
The Company recorded expense of $15,000, $466,000 and $177,000 in the twelve months ended March 31, 2010, 2009 and 2008, respectively, related to these stock options. The option activity for the year ended March 31, 2010 is as follows:
| Shares | Weighted- Average Exercise Price Per Share |
Weighted Average- Remaining Contractual Term (in years) |
Aggregate Intrinsic Value(a) (in thousands) | |||||||
| Outstanding on March 31, 2009 |
1,807,174 | 1.63 | 5.4 | $ | 156 | |||||
| Granted |
— | — | ||||||||
| Exercised |
— | — | ||||||||
| Forfeited |
(66,400 | ) | 1.49 | |||||||
| Expired |
(446,967 | ) | 1.77 | |||||||
| Outstanding on March 31, 2010 |
1,293,807 | 1.58 | 5.0 | $ | 26 | |||||
| Vested or expected to vest as of March 31, 2010 |
1,280,892 | 1.58 | 4.9 | $ | 26 | |||||
| Exercisable on March 31, 2010 |
1,221,220 | 1.58 | 4.9 | $ | 26 | |||||
| (a) | The intrinsic value for the stock options is calculated based on the difference between the exercise price of the underlying awards and the estimated fair value of the CPI stock as of the reporting date. |
- 63 -
WESTELL TECHNOLOGIES, INC. AND SUBSIDIARIES
NOTES TO CONSOLIDATED FINANCIAL STATEMENTS—(Continued)
ASC 718 requires recognition of stock-based compensation for the number of awards that are ultimately expected to vest. As of March 31, 2010, the Company used an estimated forfeiture rate of approximately 19%. The estimated forfeiture rate will be reassessed in subsequent periods and may change based on new facts and circumstances.
As of March 31, 2010, there was $47,000 of pre-tax stock option compensation expense related to non-vested awards not yet recognized, including estimated forfeitures, which is expected to be recognized over a weighted-average period of 1.5 years.
There were no options grants in fiscal year 2010 under this plan. The calculated value of each option was estimated on the date of grant using the Black-Scholes-Merton option pricing model with the following weighted-average assumptions for fiscal years 2009 and 2008.
| Fiscal Year Ended March 31 | ||||||||
| 2009 | 2008 | |||||||
| Inputs assumptions: |
||||||||
| Expected volatility |
58 | % | 42 | % | ||||
| Risk-free interest rate |
2.1 | % | 4.2 | % | ||||
| Expected life |
7 years | 5 years | ||||||
| Expected dividend yield |
0.0 | % | 0.0 | % | ||||
| Output weighted-average-grant date fair value |
$ | 0.99 | $ | 0.61 | ||||
Restricted Stock
Vesting of restricted stock is subject to continued employment with the Company. During fiscal year 2010, non-employee directors received grants of 20,000 shares each that vest 25% over four years. There were no restricted stock grants in fiscal years 2009 or 2008. As of March 31, 2010, all fiscal year 2007 restricted stock have been vested.
The Company recognizes compensation expense on a straight-line basis over the vesting periods of the awards based on the market value of Westell Technologies stock on the date of grant adjusted for estimated forfeitures.
The following table sets forth restricted stock activity for the twelve months ended March 31, 2010:
| Shares | Weighted-Average Grant Date Fair Value | |||||
| Non-vested as of March 31, 2009 |
200,000 | $ | 2.26 | |||
| Granted |
180,000 | 0.54 | ||||
| Vested |
(197,778 | ) | 2.26 | |||
| Forfeited |
(42,222 | ) | 0.39 | |||
| Non-vested as of March 31, 2010 |
140,000 | $ | 0.62 | |||
The Company recorded $115,000, $1,158,000 and $629,000 of expense in the twelve months ended March 31, 2010, 2009 and 2008, respectively, related to restricted stock. As of March 31, 2010, there was $72,000 of pre-tax unrecognized compensation expense, including estimated forfeitures, related to non-vested restricted stock, which is expected to be recognized over a weighted-average period of 3.2 years.
ASC 718 requires recognition of stock-based compensation for the number of awards that are ultimately expected to vest. As of March 31, 2010, the Company used an estimated forfeiture rate of approximately 5%. The estimated forfeiture rate will be reassessed in subsequent periods and may change based on new facts and circumstances.
- 64 -
WESTELL TECHNOLOGIES, INC. AND SUBSIDIARIES
NOTES TO CONSOLIDATED FINANCIAL STATEMENTS—(Continued)
The fiscal year 2010 stock-based compensation expense relating to restricted stock was lower, due to fewer grants, which had a smaller weighted-average grant date fair value. The fiscal year 2009 stock-based compensation for restricted stock increased compared to fiscal 2008 primarily due to a single award in fiscal 2007 for 500,000 shares of restricted stock which one-fifth vested on February 1, 2008. Per the terms of the original agreement, the remaining four-fifths of the 500,000 shares accelerated vesting in July 2008 when the holder was no longer employed by the Company.
Employee Stock Purchase Plan
The Company has an employee stock purchase plan (“ESPP”) that allows employees to purchase stock each quarter end through payroll deductions at a 15% discount from the market price on the date of purchases. There are 717,950 shares authorized under the Company’s ESPP with 202,280 of the Company’s common stock available for issuance as of March 31, 2010. Due to the current stock price and the number of shares available under the ESPP plan, the Company has suspended purchases under this plan. There were 0, 19,130 and 58,939 shares of common stock purchased under the ESPP during fiscal years 2010, 2009 and 2008, respectively. The 15% market discount for shares purchased during fiscal years 2010, 2009 and 2008 approximated $0, $4,000 and $18,000, respectively, and was recognized as compensation expense in the Consolidated Statement of Operations.
Stock-Based Compensation Expense
The following table sets forth the total stock-based compensation expense included in the Consolidated Statements of Operations, resulting from stock options, restricted stock and the employee stock purchase plan:
| Fiscal Year Ended March 31 | |||||||||
| (in thousands) | 2010 | 2009 | 2008 | ||||||
| Cost of equipment revenues |
$ | 77 | $ | 88 | $ | 209 | |||
| Cost of services |
5 | 29 | 55 | ||||||
| Sales and marketing |
365 | 315 | 287 | ||||||
| Research and development |
101 | 136 | 117 | ||||||
| General and administrative |
981 | 1,624 | 549 | ||||||
| Stock-based compensation expense |
1,529 | 2,192 | 1,217 | ||||||
| Income tax benefit |
— | — | — | ||||||
| Total stock-based compensation expense after taxes |
$ | 1,529 | $ | 2,192 | $ | 1,217 | |||
The fiscal year 2010 stock-based compensation includes a $730,000 non-cash charge to correct an error in the calculation of stock-based compensation expense for the prior year periods as disclosed above in the Stock Options section of this footnote. Stock-based compensation for the fiscal year ended March 31, 2009 increased compared to fiscal 2008 primarily due to accelerated vesting on restricted stock described above in the Restricted Stock section of this footnote.
Note 11. Benefit Plans:
Deferred Compensation
The Company had a deferred compensation program with Mr. Van Cullens, a former Chief Executive Officer, which was funded through a Rabbi trust. The Rabbi trust was subject to the creditors of the Company. All amounts deferred under this compensation program vested on March 31, 2007. In accordance with ASC 710, Compensation, accounts of the Rabbi trust were consolidated with the Company’s financial statements. The deferred compensation liability was $2.5 million as of March 31, 2008. In April 2008, the Company used the investments in the Rabbi trust to pay this deferred compensation liability in full.
401(k) Benefit Plan
The Company sponsors a 401(k) benefit plan (the “Plan”) which covers substantially all of its domestic employees. The Plan is a salary reduction plan that allows employees to defer up to 100% of wages subject to Internal Revenue Service limits. The Plan also allows for Company discretionary and matching contributions. Effective in February 2009, the Company eliminated matching
- 65 -
WESTELL TECHNOLOGIES, INC. AND SUBSIDIARIES
NOTES TO CONSOLIDATED FINANCIAL STATEMENTS—(Continued)
contributions. From January 2008 through January 2009, the matching contribution percentage made by the Company was 100% of participants’ contributions up to 4%. Participants were immediately vested in the matching contributions. Matching contribution expense in fiscal years 2009 and 2008 was approximately $804,000 and $582,000, respectively.
Note 12. Note Payable Guarantee:
In fiscal year 2005, the Company sold its Data Station Termination product lines and specified fixed assets to Enginuity Communications Corporation (“Enginuity”). The Company provided an unconditional guarantee relating to a 10-year term note payable by Enginuity to a third-party lender that financed the transaction (the “Enginuity Note”). The Enginuity Note had an unpaid balance of $854,000 and $1.0 million as of March 31, 2010 and 2009, respectively. Certain owners of Enginuity personally guaranteed the note and pledged assets as collateral. These personal guarantees will stay in place until the note is paid in full, as will the Company’s. Under the Company’s guarantee, the Company must pay all amounts due under the note payable upon demand from the lender, however, the Company would have recourse against the assets of Enginuity, the personal guarantees, and pledged assets.
The Company evaluated ASC 810 and concluded that Enginuity is a VIE as a result of the debt guarantee. The Company is not considered the primary beneficiary of the VIE and consolidation therefore is not required.
At the time of the product sale, the Company assessed its obligation under this guarantee pursuant to the provisions of FIN 45, Guarantor’s Accounting and Disclosure Requirements for Guarantees, Including Indirect Guarantees of Indebtedness of Others, as codified in ASC topic 460, Guarantees (“ASC 460”), and recorded a $300,000 liability for the value of the guarantee. The Company evaluates the fair value of the liability quarterly based on Enginuity’s operating performance and the current status of the guaranteed debt obligation. The balance of the liability is $100,000 as of March 31, 2010 and 2009. The liability is classified as a current liability in accrued expenses in the Consolidated Balance Sheets.
Note 13. Segment and Related Information:
Prior to fiscal year 2009, the Company conducted its business within two reportable segments of telecom equipment and telecom services. In the third quarter of fiscal year 2009, the Company revised its segment reporting structure to reflect the realignment of internal reporting of its CNS and OSP businesses. During fiscal year 2009, Westell’s Chief Executive Officer, the chief operating decision maker (“CODM”), implemented business unit financial reporting which changed reporting from a telecom equipment segment into a CNS and OSP segment. The underlying direct product costs, engineering and sales and marketing costs of CNS and OSP were segregated into separate cost centers for financial reporting purposes. Subsequently, the Company began reporting its financial information within the three reportable segments of CNS, OSP, and ConferencePlus.
CNS: The Company’s CNS family of broadband products enables high-speed routing and networking of voice, data, video, and other advanced services in the home. The products allow service providers to deliver services, content, and applications over existing copper, fiber, coax, and wireless infrastructures. Westell CNS products are typically installed in consumer residences or small businesses as a key component of broadband service packages.
OSP: The Company’s OSP product family consists of next generation outdoor cabinets, enclosures, power distribution, edge connectors (fiber, Ethernet and coax), remote monitoring, DS1 and DS3 transmission plugs. These solutions are optimized for wireless backhaul, service delivery to business enterprise and smart grid applications. The OSP team also provides a value-added customized systems integrations (“CSI”) service, offering its customers with a single source for complete turnkey solutions, reducing time-to-market and expenses incurred through third-party contractors and eliminating the need to design, assemble and test on the job site. Target customers include wireline service providers, wireless service providers, multi-service operators (“MSOs”), utility providers and OEMs worldwide. The power distribution and remote monitoring products are designed and provided through the Company’s Noran Tel subsidiary located in Regina, Saskatchewan, Canada.
ConferencePlus: The Company’s subsidiary Conference Plus, Inc. provides audio, web and video conferencing services. Businesses and individuals use these services to hold audio, web and video conferences with multiple participants. ConferencePlus sells its services directly to customers, including Fortune 1000 companies, and also serves customers indirectly through its private-label reseller program.
- 66 -
WESTELL TECHNOLOGIES, INC. AND SUBSIDIARIES
NOTES TO CONSOLIDATED FINANCIAL STATEMENTS—(Continued)
In fiscal 2008, CNS and OSP products were both manufactured in the Aurora, Illinois manufacturing facility and shared significant resources that were not segregated for financial reporting. As a result, the Company determined that it is impracticable to restate fiscal year 2008 to conform to the current operating segments.
In fiscal year 2009, segment operating income (loss) excluded unallocated Westell, Inc. general & administrative expenses (“G&A”). In fiscal year 2010, G&A, excluding certain corporate costs, G&A is now allocated by segment. In order to provide information that is comparable year to year, fiscal year 2009 segment information has been revised using the allocation methods used in fiscal year 2010.
Performance of these segments is primarily evaluated utilizing revenue and segment operating income (loss). The accounting policies of the segments are the same as those for Westell Technologies, Inc. described in the summary of significant accounting policies. The Company defines segment operating income (loss) as gross profit less direct expenses, including direct expenses from research and development expenses, sales and marketing expenses, and general and administrative (“G&A”). Segment operating income (loss) excludes unallocated Westell, Inc. G&A.
Segment information for the fiscal years ended March 31, 2010, 2009 and 2008 is set forth below:
| Fiscal Year Ended March 31, 2010 | ||||||||||||||||||||
| (in thousands) | CNS | OSP | CP | Unallocated | Total | |||||||||||||||
| Revenue |
$ | 87,248 | $ | 52,516 | $ | 41,721 | $ | — | $ | 181,485 | ||||||||||
| Gross profit |
14,348 | 23,042 | 20,299 | — | 57,689 | |||||||||||||||
| Gross margin |
16.4 | % | 43.9 | % | 48.7 | % | — | 31.8 | % | |||||||||||
| Operating expenses: |
||||||||||||||||||||
| Sales & marketing |
5,772 | 4,998 | 7,217 | — | 17,987 | |||||||||||||||
| Research & development |
9,024 | 2,339 | 2,245 | — | 13,608 | |||||||||||||||
| General & administrative |
3,244 | 1,998 | 6,075 | 3,778 | 15,095 | |||||||||||||||
| Goodwill impairment |
— | — | — | — | — | |||||||||||||||
| Intangible amortization |
1 | 528 | 112 | — | 641 | |||||||||||||||
| Restructuring |
414 | 46 | 149 | — | 609 | |||||||||||||||
| Operating expenses |
18,455 | 9,909 | 15,798 | 3,778 | 47,940 | |||||||||||||||
| Operating income (loss) |
(4,107 | ) | 13,133 | 4,501 | (3,778 | ) | 9,749 | |||||||||||||
| Other income (expense), net |
— | — | — | 25 | 25 | |||||||||||||||
| Interest (expense) |
— | — | — | (5 | ) | (5 | ) | |||||||||||||
| Income taxes |
— | — | — | 558 | 558 | |||||||||||||||
| Net income (loss) |
$ | (4,107 | ) | $ | 13,133 | $ | 4,501 | $ | (3,200 | ) | $ | 10,327 | ||||||||
| Fiscal Year Ended March 31, 2009 | ||||||||||||||||||||
| (in thousands) | CNS | OSP | CP | Unallocated | Total | |||||||||||||||
| Revenue |
$ | 84,207 | $ | 56,506 | $ | 45,203 | $ | — | $ | 185,916 | ||||||||||
| Gross profit |
8,142 | 22,808 | 20,224 | — | 51,174 | |||||||||||||||
| Gross margin |
9.7 | % | 40.4 | % | 44.7 | % | — | 27.5 | % | |||||||||||
| Operating expenses: |
||||||||||||||||||||
| Sales & marketing |
9,464 | 5,468 | 9,221 | — | 24,153 | |||||||||||||||
| Research & development |
15,029 | 2,604 | 2,221 | — | 19,854 | |||||||||||||||
| General & administrative |
3,977 | 2,558 | 7,885 | 5,616 | 20,036 | |||||||||||||||
| Goodwill impairment |
— | 1,381 | — | — | 1,381 | |||||||||||||||
| Intangible amortization |
— | 1,823 | 59 | — | 1,882 | |||||||||||||||
| Restructuring |
363 | 220 | 169 | — | 752 | |||||||||||||||
| Operating expenses |
28,833 | 14,054 | 19,555 | 5,616 | 68,058 | |||||||||||||||
| Operating income (loss) |
(20,691 | ) | 8,754 | 669 | (5,616 | ) | (16,884 | ) | ||||||||||||
| Other income (expense), net |
— | — | — | 662 | 662 | |||||||||||||||
| Interest (expense) |
— | — | — | (15 | ) | (15 | ) | |||||||||||||
| Income taxes |
— | — | — | (77 | ) | (77 | ) | |||||||||||||
| Minority Interest |
— | — | — | (74 | ) | (74 | ) | |||||||||||||
| Discontinued operations |
— | — | — | (206 | ) | (206 | ) | |||||||||||||
| Net income (loss) |
$ | (20,691 | ) | $ | 8,754 | $ | 669 | $ | (5,326 | ) | $ | (16,594 | ) | |||||||
- 67 -
WESTELL TECHNOLOGIES, INC. AND SUBSIDIARIES
NOTES TO CONSOLIDATED FINANCIAL STATEMENTS—(Continued)
| Fiscal Year Ended March 31, 2008 | ||||||||||||||||
| (in thousands) | Combined Equipment |
CP | Unallocated | Total | ||||||||||||
| Revenue (a) |
$ | 152,031 | $ | 53,698 | $ | — | $ | 205,729 | ||||||||
| Gross profit |
34,619 | 25,821 | — | 60,440 | ||||||||||||
| Gross margin |
22.8 | % | 48.1 | % | — | 29.4 | % | |||||||||
| Operating expenses: |
||||||||||||||||
| Sales & marketing |
12,352 | 11,715 | — | 24,067 | ||||||||||||
| Research & development |
19,946 | 2,404 | — | 22,350 | ||||||||||||
| General & administrative |
13,722 | 7,815 | — | 21,537 | ||||||||||||
| Goodwill impairment |
9,651 | — | — | 9,651 | ||||||||||||
| Intangible amortization |
1,834 | — | — | 1,834 | ||||||||||||
| Restructuring |
5,717 | — | — | 5,717 | ||||||||||||
| Operating expenses |
63,222 | 21,934 | — | 85,156 | ||||||||||||
| Operating income (loss) |
(28,603 | ) | 3,887 | — | (24,716 | ) | ||||||||||
| Other income (expense), net |
— | — | 3,709 | 3,709 | ||||||||||||
| Interest (expense) |
— | — | (12 | ) | (12 | ) | ||||||||||
| Income taxes |
— | — | (53,495 | ) | (53,495 | ) | ||||||||||
| Minority Interest |
— | — | (260 | ) | (260 | ) | ||||||||||
| Discontinued operations |
— | — | (1,456 | ) | (1,456 | ) | ||||||||||
| Net income (loss) |
$ | (28,603 | ) | $ | 3,887 | $ | (51,514 | ) | $ | (76,230 | ) | |||||
| (a) | CNS revenue was $97,923 and OSP revenue was $54,108 |
| Fiscal Year Ended March 31, | |||||||||
| Depreciation and amortization (in thousands) |
2010 | 2009 | 2008 | ||||||
| CNS depreciation and amortization |
$ | 1,280 | $ | 1,681 | $ | NA | |||
| OSP depreciation and amortization |
1,023 | 2,393 | NA | ||||||
| Combined equipment and unallocated depreciation and amortization |
2,303 | 4,074 | 6,127 | ||||||
| ConferencePlus services depreciation and amortization |
1,490 | 1,745 | 1,701 | ||||||
| Total depreciation and amortization |
$ | 3,793 | $ | 5,819 | $ | 7,828 | |||
The CNS and OSP segments use many of the same assets. For internal reporting purposes, the Company does not allocate assets between the CNS and OSP segments and therefore no asset or capital expenditure information by each of these segments is available. Combined CNS and OSP segment information is provided below.
| March 31, | ||||||
| Assets, excluding cash and cash equivalents (in thousands) |
2010 | 2009 | ||||
| Combined equipment segments assets |
$ | 50,437 | $ | 58,037 | ||
| ConferencePlus services assets |
10,082 | 7,761 | ||||
| Total assets, excluding cash and cash equivalents |
$ | 60,519 | $ | 69,509 | ||
Enterprise-wide Information
The Company’s revenues are primarily generated in the United States. More than 90% of all revenues were generated in the United States in fiscal years 2010, 2009 and 2008.
- 68 -
WESTELL TECHNOLOGIES, INC. AND SUBSIDIARIES
NOTES TO CONSOLIDATED FINANCIAL STATEMENTS—(Continued)
Significant Customers and Concentration of Credit
The Company is dependent on certain major telephone companies that represent more than 10% of the total revenue. Sales to major customers and successor companies that exceed 10% of total revenue are as follows:
| Fiscal Year Ended March 31, | |||||||||
| 2010 | 2009 | 2008 | |||||||
| Verizon |
41.6 | % | 44.0 | % | 34.4 | % | |||
| AT&T |
13.4 | % | 12.5 | % | 20.0 | % | |||
Verizon is a customer to the OSP segment and the CNS segment. AT&T is a customer of all three segments.
Major telephone companies comprise a significant portion of the Company’s trade receivables. Receivables from major customers that exceed 10% of total accounts receivable balance are as follows:
| Fiscal Year Ended March 31, | ||||||
| 2010 | 2009 | |||||
| Verizon |
19.2 | % | 41.3 | % | ||
| AT&T |
15.3 | % | 8.7 | % | ||
Geographic Information
The Company’s financial information by geographic area was as follows for the fiscal years ended March 31:
| (in thousands) | Domestic | International | Total | |||||||||
| 2010 |
||||||||||||
| Revenue |
$ | 169,105 | $ | 12,380 | $ | 181,485 | ||||||
| Operating income (loss) |
8,562 | 1,187 | 9,749 | |||||||||
| Total assets |
113,461 | 8,373 | 121,834 | |||||||||
| 2009 |
||||||||||||
| Revenue |
$ | 174,485 | $ | 11,431 | $ | 185,916 | ||||||
| Operating income (loss) |
(15,754 | ) | (1,130 | ) | (16,884 | ) | ||||||
| Total assets |
108,383 | 7,181 | 115,564 | |||||||||
| 2008 |
||||||||||||
| Revenue |
$ | 192,929 | $ | 12,800 | $ | 205,729 | ||||||
| Operating income (loss) |
(24,818 | ) | 102 | (24,716 | ) | |||||||
| Total assets |
122,881 | 11,347 | 134,228 | |||||||||
International identifiable assets, revenues and operating income (loss) are related to Conference Plus Global Services, Ltd., which has locations in Dublin, Ireland and London, England and Noran Tel, Inc. which is located in Regina, Saskatchewan, Canada.
Note 14. Restructuring:
In the first quarter of fiscal year 2010, the Company initiated a cost reduction action that resulted in the termination of approximately 50 employees, consisting of 30 employees primarily in the CNS segment and 20 employees in the ConferencePlus segment. The total cost of this restructuring action was $609,000, of which $414,000, $46,000 and $149,000 was recorded in the CNS, OSP and ConferencePlus segments, respectively. As of March 31, 2010, all of these costs had been paid.
In the third quarter of fiscal year 2009, the Company initiated a reduction in force of 20 employees impacting all three operating segments. As a result of these actions, the Company recorded employee termination costs of $808,000 of which $399,000, $240,000 and $169,000 was recorded in the CNS, OSP and ConferencePlus segments, respectively. As of March 31, 2009 approximately $527,000 has been paid leaving an unpaid balance of $281,000. As of March 31, 2010, all of these costs have been paid.
- 69 -
WESTELL TECHNOLOGIES, INC. AND SUBSIDIARIES
NOTES TO CONSOLIDATED FINANCIAL STATEMENTS—(Continued)
In the fourth quarter of fiscal 2008, the Company recognized restructuring expense of $504,000 at the Westell Limited facility located in the United Kingdom for personnel costs related to the termination of six employees and an early lease termination cost for its facility. In the first quarter of fiscal year 2009, the Company decided to cease the operations of its Westell Limited subsidiary. All remaining employees were terminated and the facility was closed. The Company recorded $214,000 related to severance expense for the last 5 employees and $277,000 to write down assets in the quarter ended June 30, 2008. As of March 31, 2009, all of these costs have been paid in full. Westell Limited is shown as discontinued operations in the Company’s Consolidated Statements of Operations.
In May 2007, the Company announced it would move substantially all of the Company’s Aurora, Illinois, manufacturing operations in the CNS and OSP segments to offshore suppliers. In connection with this plan, the Company recognized restructuring expense of $5.7 million in fiscal year 2008. This charge included personnel costs related to the termination of 443 employees. The Company recorded a reversal of expenses of $56,000 in the year ended March 31, 2009 related to a change in estimated severance and outplacement costs. As of March 31, 2009, all of these costs have been paid in full.
The restructuring charges and their utilization are summarized as follows:
| (in thousands) | Employee -related |
Legal, other and facility costs |
Total | |||||||||
| Liability at March 31, 2007 |
$ | 198 | $ | 48 | $ | 246 | ||||||
| Charged |
6,100 | 121 | 6,221 | |||||||||
| Utilized |
(4,037 | ) | (46 | ) | (4,083 | ) | ||||||
| Liability at March 31, 2008 |
2,261 | 123 | 2,384 | |||||||||
| Charged |
977 | (11 | ) | 966 | ||||||||
| Utilized |
(2,960 | ) | (109 | ) | (3,069 | ) | ||||||
| Liability at March 31, 2009 |
278 | 3 | 281 | |||||||||
| Charged |
609 | — | 609 | |||||||||
| Utilized |
(887 | ) | (3 | ) | (890 | ) | ||||||
| Liability at March 31, 2010 |
$ | — | $ | — | $ | — | ||||||
Note 15. Fair Value Measurements
On April 1, 2008, the Company adopted FAS 157, as codified in ASC topic 820, Fair Value Measurements and Disclosures (“ASC 820”), for all financial instruments and non-financial instruments accounted for at fair value on a recurring basis. Fair value is defined by ASC 820 as the price that would be received upon selling an asset or paid to transfer a liability in an orderly transaction between market participants at the measurement date. ASC 820 establishes a three-level fair value hierarchy that prioritizes the inputs used to measure fair value. The hierarchy requires entities to maximize the use of observable inputs and minimize the use of unobservable inputs. The three levels of inputs used to measure fair value are as follows:
| • | Level 1 – Quoted prices in active markets for identical assets and liabilities. |
| • | Level 2 – Quoted prices in active markets for similar assets and liabilities, or other inputs that are observable for the asset or liability, either directly or indirectly, for substantially the full term of the financial instrument. |
| • | Level 3 – Unobservable inputs that are supported by little or no market activity and that are significant to the fair value of the assets and liabilities. This includes certain pricing models, discounted cash flow methodologies and similar techniques that use significant unobservable inputs. |
Substantially all of the Company’s financial assets that are measured at fair value on a recurring basis are measured using Level 1 inputs with the exception of the note payable guarantee described in Note 12 which is measured using Level 3 inputs.
- 70 -
WESTELL TECHNOLOGIES, INC. AND SUBSIDIARIES
NOTES TO CONSOLIDATED FINANCIAL STATEMENTS—(Continued)
The following table presents financial assets and liabilities measured at fair value on a recurring basis and their related valuation inputs as of March 31, 2010:
| (in thousands) | Total Fair Value of Asset or Liability |
Quoted Prices in Active Markets for Identical Assets (Level 1) |
Significant Other Observable Inputs (Level 2) |
Significant Unobservable Inputs (Level 3) | |||||||
| Assets: |
|||||||||||
| Money markets |
$ | 19,933 | $ | 19,933 | — | — | |||||
| Liabilities: |
|||||||||||
| Guarantee |
$ | 100 | — | — | $ | 100 | |||||
The following table presents financial assets and liabilities measured at fair value on a recurring basis and their related valuation inputs as of March 31, 2009:
| (in thousands) | Total Fair Value of Asset or Liability |
Quoted Prices in Active Markets for Identical Assets (Level 1) |
Significant Other Observable Inputs (Level 2) |
Significant Unobservable Inputs (Level 3) | |||||||
| Assets: |
|||||||||||
| Money markets |
$ | 36,297 | $ | 36,297 | — | — | |||||
| Liabilities: |
|||||||||||
| Guarantee |
$ | 100 | — | — | $ | 100 | |||||
The fair value of the money market investments approximate their carrying amounts due to the short-term nature of these financial assets.
Note 16. Net Income (Loss) Per Share:
The computation of basic net income (loss) per share is computed using the weighted-average number of common shares outstanding during the period. Diluted net income per share includes the number of additional common shares that would have been outstanding if the dilutive potential shares had been issued. In periods with a net loss, all common stock equivalents are excluded from the per share calculation; therefore, the basic loss per share equals the diluted loss per share.
The following table sets forth the computation of basic and diluted net income (loss) per share:
| Fiscal Year Ended March 31, | |||||||||||
| (in thousands, except per share amounts) | 2010 | 2009 | 2008 | ||||||||
| As adjusted (See Note 3) |
|||||||||||
| Net income (loss): |
|||||||||||
| Net income (loss) from continuing operations |
$ | 10,327 | $ | (16,388 | ) | $ | (74,774 | ) | |||
| Net income (loss) from discontinued operations |
— | (206 | ) | (1,456 | ) | ||||||
| Net income (loss) |
$ | 10,327 | $ | (16,594 | ) | $ | (76,230 | ) | |||
| Weighted-average shares outstanding: |
|||||||||||
| Weighted-average basic shares outstanding |
67,987 | 69,740 | 70,376 | ||||||||
| Effect of dilutive securities: restricted stock and stock options |
586 | — | — | ||||||||
| Weighted-average diluted shares outstanding |
68,573 | 69,740 | 70,376 | ||||||||
| Basic net income (loss) per share: |
|||||||||||
| Basic net income (loss) from continuing operations |
$ | 0.15 | $ | (0.24 | ) | $ | (1.06 | ) | |||
| Basic net income (loss) from discontinued operations |
$ | — | $ | (0.00 | ) | $ | (0.02 | ) | |||
| Basic net income (loss) per share |
$ | 0.15 | $ | (0.24 | ) | $ | (1.08 | ) | |||
| Diluted net income (loss) per share: |
|||||||||||
| Diluted net income (loss) from continuing operations |
$ | 0.15 | $ | (0.24 | ) | $ | (1.06 | ) | |||
| Diluted net income (loss) from discontinued operations |
$ | — | $ | (0.00 | ) | $ | (0.02 | ) | |||
| Diluted net income (loss) per share |
$ | 0.15 | $ | (0.24 | ) | $ | (1.08 | ) | |||
- 71 -
WESTELL TECHNOLOGIES, INC. AND SUBSIDIARIES
NOTES TO CONSOLIDATED FINANCIAL STATEMENTS—(Continued)
The Company had 6.1 million options outstanding as of March 31, 2010, which were not included in the computation of average diluted shares outstanding as they were anti-dilutive.
Note 17. Quarterly Results of Operations (Unaudited):
The following tables present certain financial information for each of the last eight fiscal quarters. The Company believes that the unaudited information regarding each of these quarters is prepared on the same basis as the audited Consolidated Financial Statements of the Company appearing elsewhere in this Form 10-K. In the opinion of management, all necessary adjustments (consisting only of normal recurring adjustments) have been included to present fairly the unaudited quarterly results when read in conjunction with the audited Consolidated Financial Statements of the Company and the Notes thereto appearing elsewhere in this Form 10-K. These quarterly results of operations are not necessarily indicative of the results for any future period.
The quarterly fluctuations in revenue and gross profit are due primarily to fluctuations in the CNS segment. These fluctuations are due to product mix between the ULS3, modem and gateway products, quantity shipped and generally declining sales prices.
| Fiscal Year 2010 Quarter Ended | ||||||||||||||
| June 30, 2009 | Sept. 30, 2009 | Dec. 31, 2009 | Mar. 31, 2010 | |||||||||||
| As adjusted (See Note 3) |
||||||||||||||
| (in thousands, except per share amounts) | ||||||||||||||
| Revenue |
$ | 53,513 | $ | 47,353 | $ | 42,796 | $ | 37,823 | ||||||
| Gross profit |
15,207 | 14,572 | 13,771 | 14,139 | ||||||||||
| Operating expenses |
13,163 | 11,588 | 11,704 | 11,485 | ||||||||||
| Income tax |
(155 | ) | (75 | ) | 673 | 115 | ||||||||
| Net income (loss) |
1,978 | 2,887 | 2,736 | 2,726 | ||||||||||
| Net income (loss) per common share: |
||||||||||||||
| Basic |
$ | 0.03 | $ | 0.04 | $ | 0.04 | $ | 0.04 | ||||||
| Diluted |
$ | 0.03 | $ | 0.04 | $ | 0.04 | $ | 0.04 | ||||||
Operating expenses in fiscal year 2010 included the following items: the June 30, 2009 quarter included $609,000 of restructuring costs, the December 31, 2009 quarter included a $730,000 non-cash charge to correct errors in stock-based compensation expense related to prior fiscal years and a $767,000 income tax benefit derived from a refund of alternative minimum tax credits.
| Fiscal Year 2009 Quarter Ended | ||||||||||||||||
| June 30, 2008 | Sept. 30, 2008 | Dec. 31, 2008 | Mar. 31, 2009 | |||||||||||||
| As adjusted (See Note 3) |
As adjusted (See Note 3) |
|||||||||||||||
| (in thousands, except per share amounts) | ||||||||||||||||
| Revenue |
$ | 38,058 | $ | 43,120 | $ | 48,755 | $ | 55,983 | ||||||||
| Gross profit |
12,847 | 13,110 | 12,372 | 12,845 | ||||||||||||
| Operating expenses |
18,009 | 18,405 | 16,475 | 15,169 | ||||||||||||
| Income tax |
(27 | ) | (48 | ) | 57 | (59 | ) | |||||||||
| Net income (loss) |
(5,521 | ) | (5,109 | ) | (4,022 | ) | (1,942 | ) | ||||||||
| Net income (loss) per common share: |
||||||||||||||||
| Basic |
$ | (0.08 | ) | $ | (0.07 | ) | $ | (0.06 | ) | $ | (0.03 | ) | ||||
| Diluted |
$ | (0.08 | ) | $ | (0.07 | ) | $ | (0.06 | ) | $ | (0.03 | ) | ||||
Operating expenses in fiscal year 2009 included the following items: the September 30, 2008 quarter was impacted by $1.3 million of severance and stock-based compensation expense related to the accelerated vesting of restricted stock both for the former CEO,
- 72 -
WESTELL TECHNOLOGIES, INC. AND SUBSIDIARIES
NOTES TO CONSOLIDATED FINANCIAL STATEMENTS—(Continued)
Thomas Mader; the December 31, 2008 quarter included $808,000 of restructuring expense and $1.4 million of goodwill impairment charges in the OSP segment; and in the quarter ended March 31, 2009, the Company recorded a $700,000 loss contingency for a contractual dispute as a component of cost of services in the ConferencePlus segment (in April 2010, a settlement agreement was reached for the $700,000) and a $925,000 non-cash rent charge to correct the Company’s lease accounting policy.
- 73 -
WESTELL TECHNOLOGIES, INC. AND SUBSIDIARIES
SCHEDULE II — VALUATION AND QUALIFYING ACCOUNTS
| (In thousands) | Balance Beginning Of Year |
Net Additions Charged to Cost And Expenses |
Additions (Deductions) |
Balance at End of Year | ||||||||||
| 2010 |
||||||||||||||
| Accounts receivable allowances |
$ | 289 | $ | 49 | $ | (101 | )(1) | $ | 237 | |||||
| Reserve for excess and obsolete inventory and net realizable value |
1,336 | 598 | (243 | )(2) | 1,691 | |||||||||
| Deferred tax assets valuation allowance |
65,108 | — | (3,811 | ) | 61,297 | |||||||||
| Reserve for returns |
10 | 97 | (92 | ) | 15 | |||||||||
| 2009 |
||||||||||||||
| Accounts receivable allowances |
$ | 281 | $ | 110 | $ | (102 | )(1) | $ | 289 | |||||
| Reserve for excess and obsolete inventory and net realizable value |
3,290 | 580 | (2,534 | )(2) | 1,336 | |||||||||
| Deferred tax assets valuation allowance |
59,657 | — | 5,451 | 65,108 | ||||||||||
| Reserve for returns |
30 | 110 | (130 | ) | 10 | |||||||||
| 2008 |
||||||||||||||
| Accounts receivable allowances |
$ | 290 | $ | 97 | $ | (106 | )(1) | $ | 281 | |||||
| Reserve for excess and obsolete inventory and net realizable value |
3,016 | 2,000 | (1,726 | )(2) | 3,290 | |||||||||
| Deferred tax assets valuation allowance |
8,461 | 57,886 | (3) | (6,690 | )(3) | 59,657 | ||||||||
| Reserve for returns |
30 | 224 | (224 | ) | 30 | |||||||||
| (1) | Accounts written off, net of recoveries |
| (2) | Inventory scrapped against inventory reserves. |
| (3) | Amounts reclassified to unrecognized tax benefit liability with the adoption of FIN 48 (See Note 6). |
- 74 -